|
<< Click to Display Table of Contents >> Graph Options |
  
|
|
<< Click to Display Table of Contents >> Graph Options |
  
|

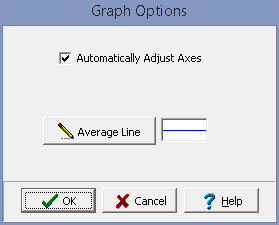
The following can be specified for the graph options:
Automatically Adjust Axes: If checked the minimum and maximum of the axes will be adjusted to fit the data.
Average Line: If displayed, click this button to change the width, color and style for the line drawn through the average of the data.
Fitted Line: If displayed, click this button to change the width, color and style for the line drawn through the data.