|
<< Click to Display Table of Contents >> Depth vs Time |
  
|
|
<< Click to Display Table of Contents >> Depth vs Time |
  
|
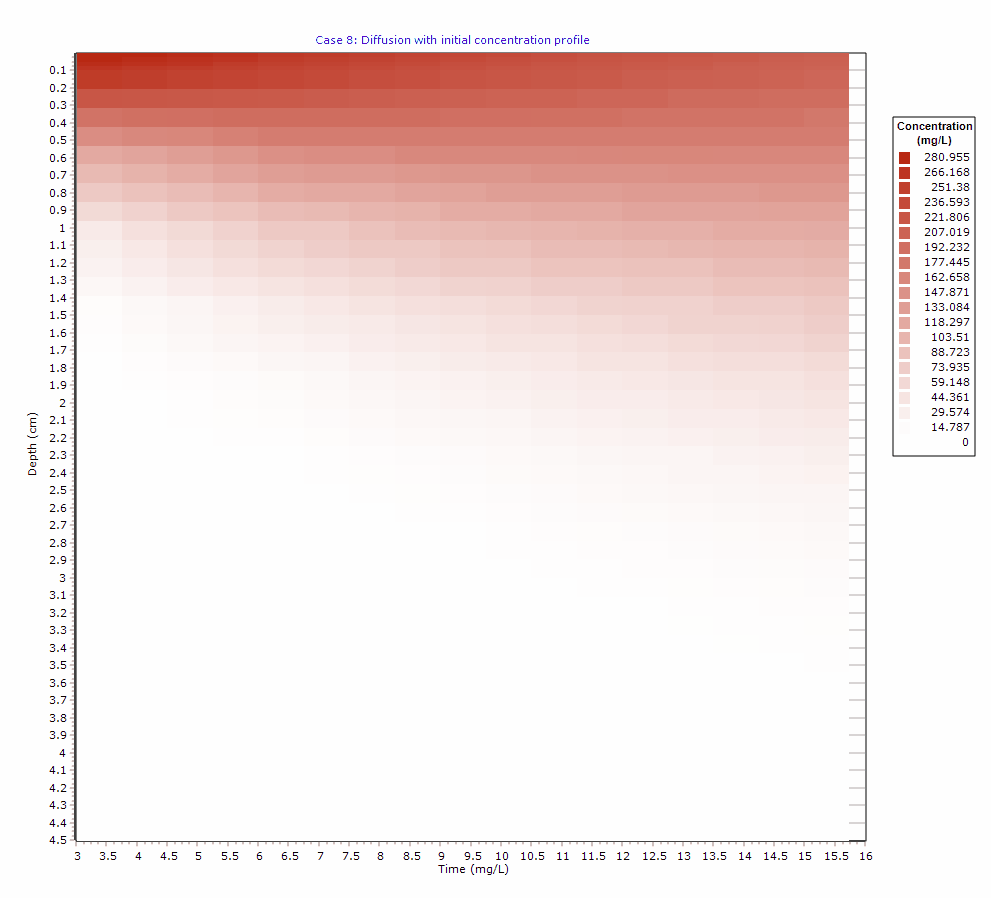
This chart will display the depth versus time as colored grid, with the concentration determining the color.
