|
<< Click to Display Table of Contents >> Probability vs Concentration |
  
|
|
<< Click to Display Table of Contents >> Probability vs Concentration |
  
|
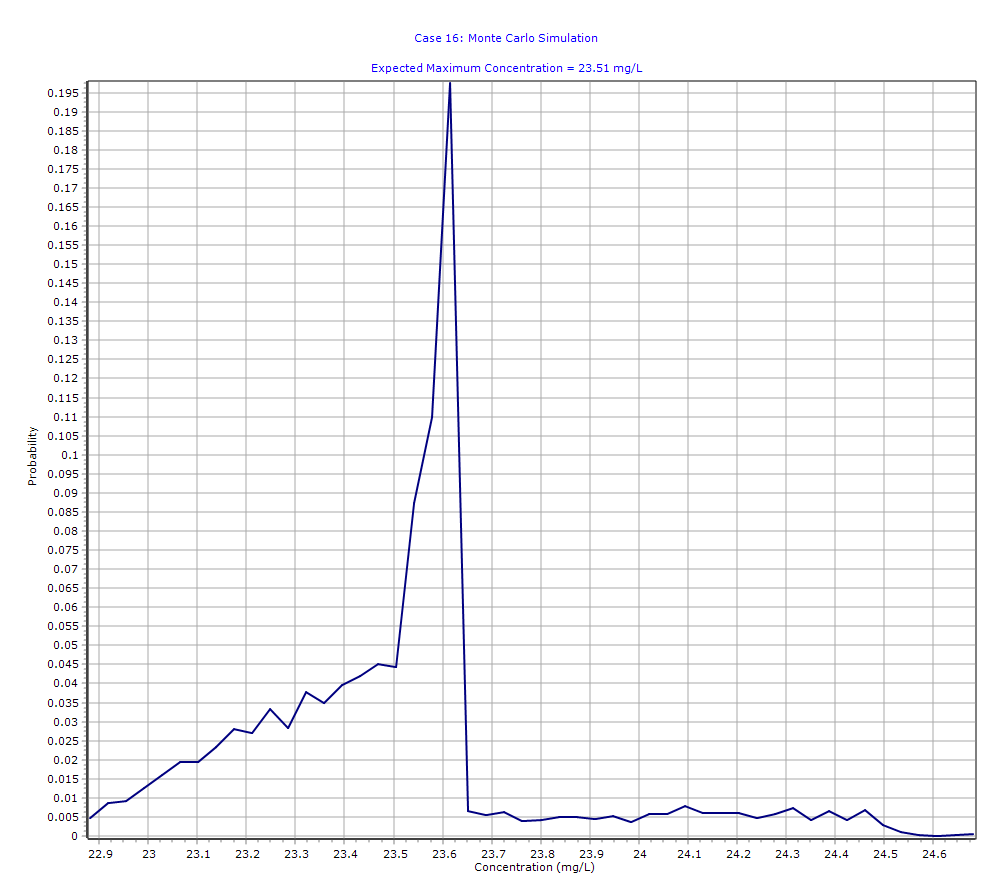
This chart will display the probability versus concentration.
