|
<< Click to Display Table of Contents >> Creating a Geotechnical Test Chart |
  
|
|
<< Click to Display Table of Contents >> Creating a Geotechnical Test Chart |
|
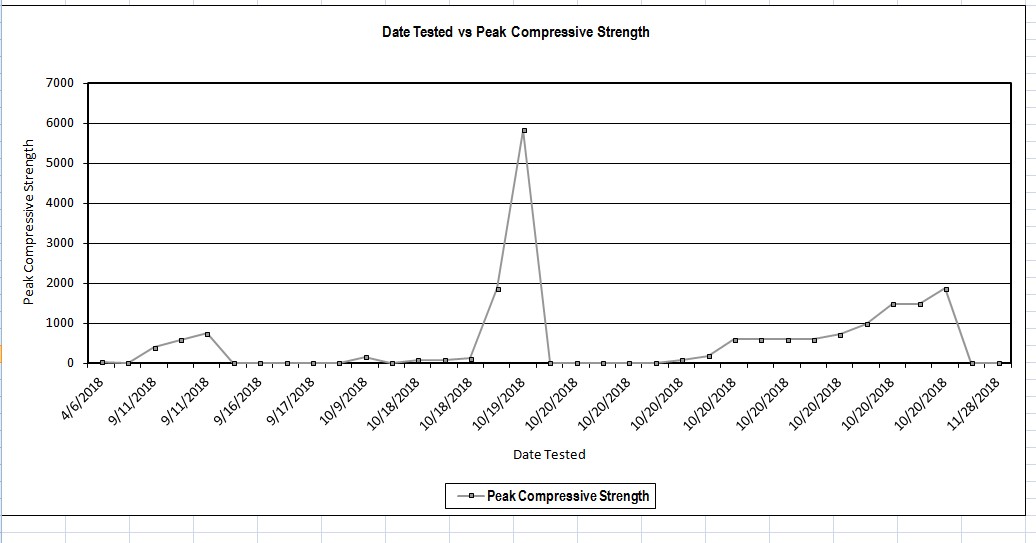
Geotechnical test charts can be used to display graphs of geotechnical test results as shown in the spreadsheet below. To create a new geotechnical test chart for a project select File > Export > Excel Charts > Geotechnical Tests. The Geotechnical Test Chart form will be displayed.
At the top of the form there are buttons for opening and saving scripts. Scripts are used to save the settings in a form and can be used to generate charts and crosstabs. Crosstabs are used to generate Excel spreadsheets that contain more then one table using previously stored scripts.
Charts can be either dynamic or non-dynamic. Dynamic charts are created with the latest data every time they are opened. Non-dynamic charts are static and stored in the Datastore, these charts will show the data at the time they were created.
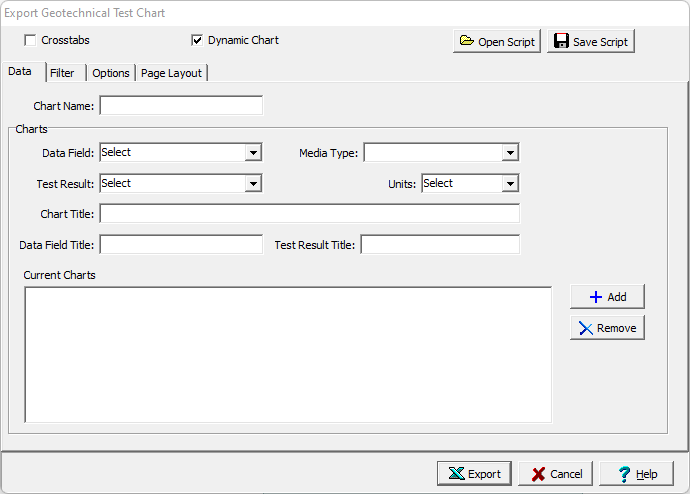
If the Crosstabs is not checked, this form has four tabs for Data, Filter, Options, and Page Layout described below. If the crosstabs is checked this form will have one tab for Crosstabs described below.
Each Excel spreadsheet can contain one or more individual charts used to display different data fields and parameters. The editing of these tabs is described in the sections below. After the information on the tabs has been entered, the Export button at the bottom of the form will export the data to an Excel spreadsheet. When the spreadsheet has been generated it will be opened in Excel.