|
<< Click to Display Table of Contents >> Options Tab |
  
|
|
<< Click to Display Table of Contents >> Options Tab |
  
|

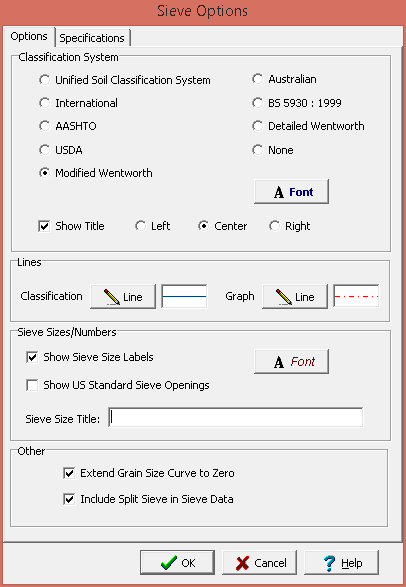
The following can be specified for the options tab:
Classification System
The soil classification (Unified, International, AASHTO, USDA, Modified Wentworth, etc.) is used to determine the percentages of gravel, sand, silt, and clay in the sample. The classification system is also plotted beneath the graph. If None is selected then no classification system will be used.
Font: Click this button to change the font used to display the classification system on the graph.
Show Title: Check this box to show the name of the classification system on the graph. If the title is to be shown the horizontal alignment can be selected.
Lines
Classification Line: Click this button to change the type, width, and color of the lines to be used to draw the Classification system below the graph.
Graph Line: Click this button to change the type, width, and color of the lines to be used to draw the Classification system within the graph.
Sieve Sizes/Numbers
Show Sieve Size Labels: Check this box to show the Standard Sieves and Numbers above the graph. If unchecked no sieve sizes or opening labels will be shown.
Show US Standard Sieve Openings: Check this box to show the US Standard Sieve Openings labels above the graph.
Sieve Size Title: If the Show US Standard Sieve Openings box is not checked, this is the title to display for the sieve sizes above the graph.
Font: Click this box to change the font used to display the labels and openings.
Other
Extend Grain Size Curve to Zero: Check this box to extend the grain size curve to zero on the right of the graph. Otherwise, the curve will stop at the last measurement.
Include Split Sieve in Sieve Data: Check this box to include the sieve used for splitting in the data.