|
<< Click to Display Table of Contents >> Reporting |
  
|
|
<< Click to Display Table of Contents >> Reporting |
  
|
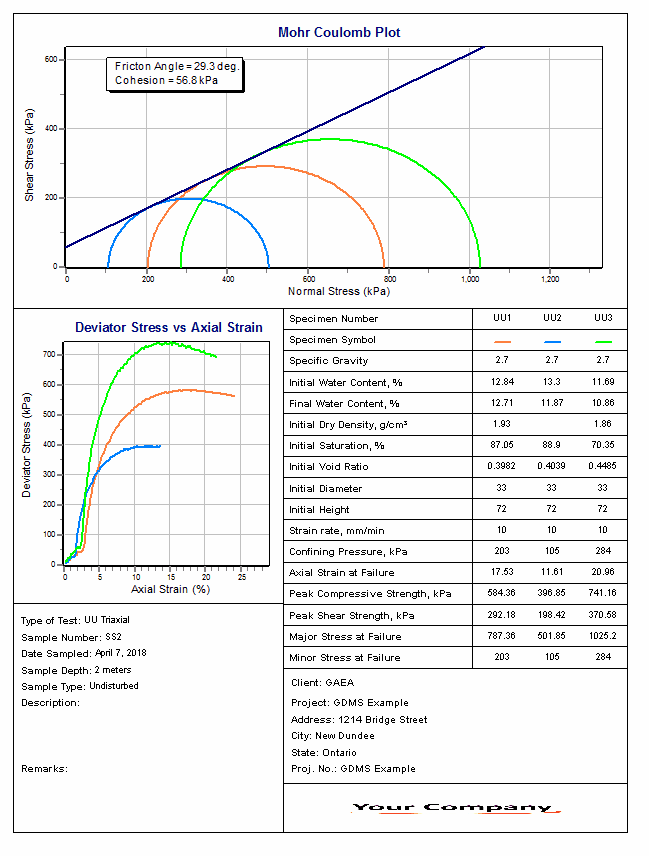
After the data has been entered and the results calculated they are displayed on a one page report. The format and layout of this report is defined by the template that was selected when the test was created. Depending on the template, a report can have one or more elements consisting of title blocks, legends, tables, graphs, etc. The majority of the information on the report is filled in by the program. On some title blocks there is user specified information that can be entered. To enter this information, edit the title block

Additional test results from other tests can be shown on the report by adding them using the Edit menu. The additional test results will be shown in the legend and graphs, but will not be shown in any of the tables.
The graphs on this report contain the results of three tests; this test, UU1 (red curve), UU2 (blue curve), and UU3 (green curve). On the Mohr Coulomb Plot the Mohr envelope, approximately tangent to the Mohr circles, is also drawn. The Mohr envelope will only be drawn if more than one test result is displayed (it requires a minimum of 2 Mohr circles). Using the Mohr envelope the Angle of Internal Friction and Cohesion can be determined and displayed. The options for these graphs are set in the template.
A datasheet containing all of the data and results can also be displayed and printed. The datasheet will contain a text version of the data and results for the test. It will not contain any additional test results that are added from other tests.
This report can be printed or exported to a PDF file.