

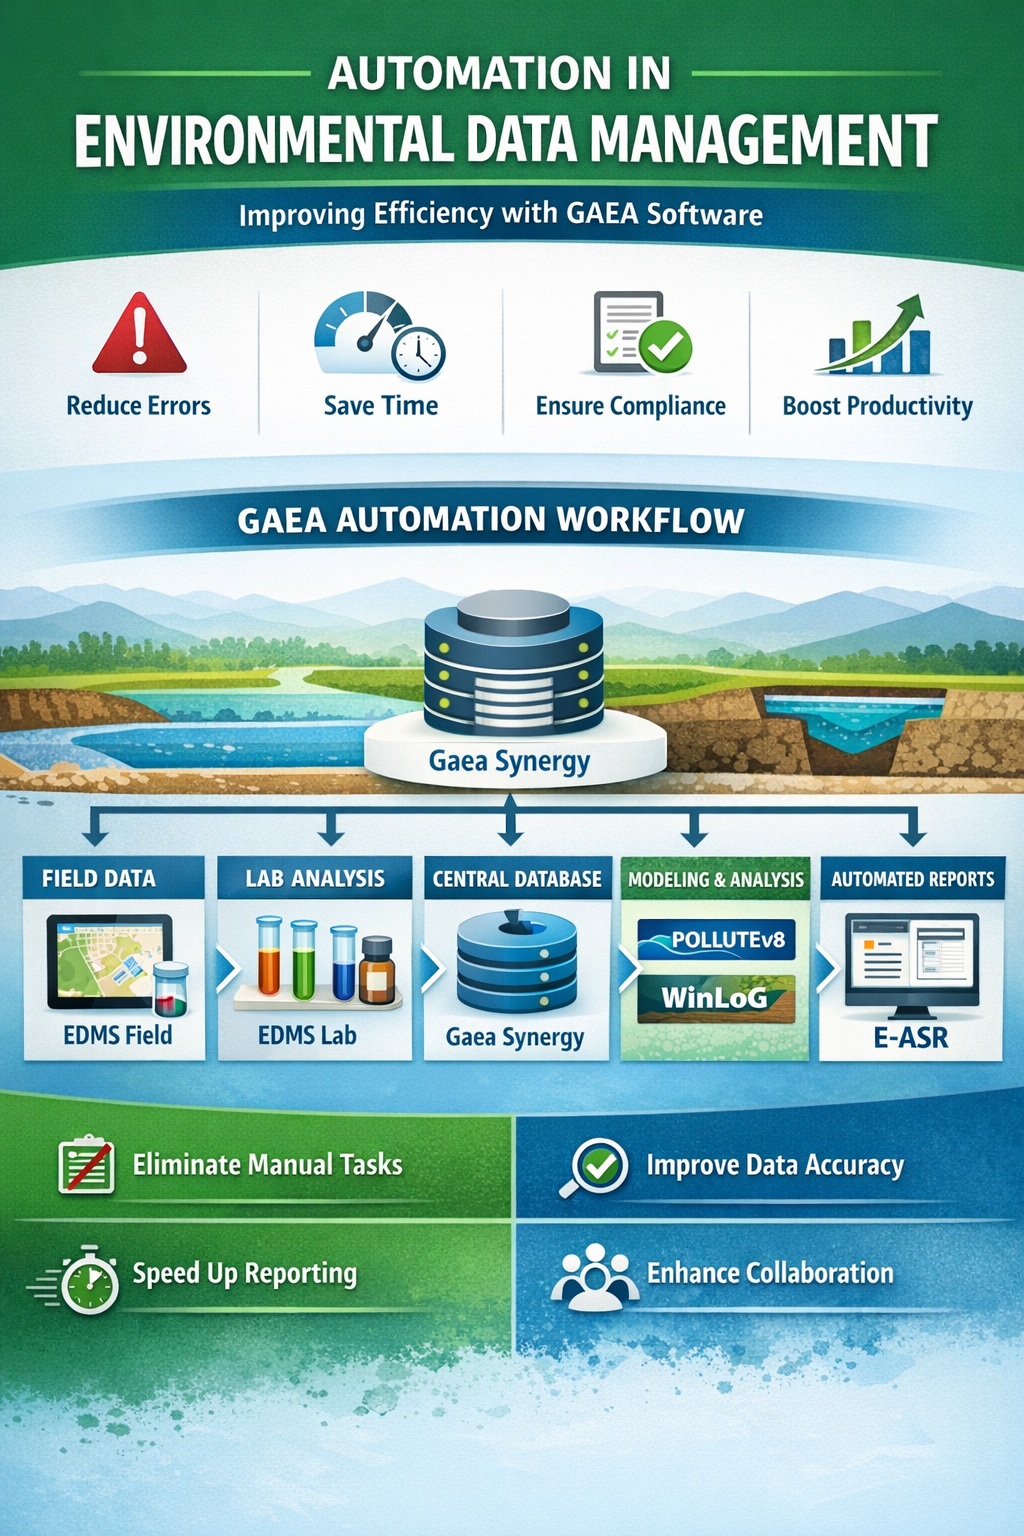
Environmental reporting costs are spread across many small tasks: receiving laboratory files, resolving sample names, preparing tables, checking comparisons, assembling documents, and incorporating review comments. Each task may appear manageable on its own. Across recurring monitoring programmes and assessment projects, however, repeated handling can consume time that the team would prefer to spend on interpretation and client work.
A business case for EDMS and E-ASR should make that work visible. It should identify which activities might change, measure their current effort, and compare achievable benefits with the full cost of implementation. The result is a testable operating model, not a promise that buying software automatically reduces expenditure.
Separate the roles of EDMS and E-ASR
EDMS supports environmental project information, including sampling records, laboratory results, review, criteria comparisons, and reporting outputs. E-ASR supports assessment-report preparation using configured questions, templates, and conditional content. They address related stages, but their contributions should be evaluated separately.
For example, a team might investigate whether structured result handling reduces table-preparation effort, then separately test whether a configured report template reduces repetitive document assembly. Confirm the products, licensing, configuration, and supported handoffs required for the proposed process. Do not assume that every table or attachment transfers automatically between applications.
1. Establish a baseline that reflects real work
Select completed projects that represent the work you expect to repeat. Include ordinary cases and a few that required corrections or unusual reporting. Divide the time record into activities rather than asking staff for a single estimate of total reporting time. This makes it easier to identify which steps the proposed workflow can realistically affect.
- Laboratory-data receipt, formatting, and preparation.
- Sample and parameter reconciliation, including exceptions.
- Data review and comparison with selected criteria.
- Table, graph, and figure preparation.
- Document assembly and routine formatting.
- Technical review, corrections, and final issue preparation.
Use timesheets where they provide sufficient detail, supplemented by a short observation exercise if necessary. Define the start and finish of each activity consistently. Record active working time separately from elapsed waiting time: a two-day delay for missing information is not automatically two days of labour that software can save.
Keep different report families separate when their requirements differ substantially. A routine monitoring update and a complex assessment may share tools but have different effort profiles. Calculate a baseline for each family, then combine the results using realistic annual volumes. An average drawn from unlike projects can hide both the best opportunities and the implementation challenges.
2. Translate time into a transparent cost model
A useful starting calculation is: annual baseline labour cost = annual report volume × average measured hours per report × the applicable hourly labour cost. Where several roles participate, calculate their time separately using the organization’s approved cost assumptions.
Use a fully burdened internal labour rate if the purpose is to estimate the cost of staff capacity. A client billing rate answers a different question and should not be substituted without explanation. The billing rate includes commercial assumptions; it is not the amount of cash automatically saved when a task takes one hour less.
Include recurring correction effort in the baseline, but avoid counting it twice. If the measured review hours already include formatting corrections, do not add a separate formatting-rework allowance for the same activity. Keep a short note explaining each input, its source, and whether it was measured or estimated.
3. Test where time can actually be released
Potential improvements should be linked to a specific task. Instead of assuming a general percentage reduction across all reporting, test whether a repeatable import requires less preparation, whether tables are easier to regenerate, or whether the questionnaire and template reduce repeated document editing. Record any new checks or maintenance tasks introduced by the process.
Preserve necessary technical review in the proposed workflow. Less time spent fixing inconsistent labels may be useful, but it does not justify removing interpretation or approval work. A realistic estimate distinguishes repetitive preparation from the professional work that remains essential for a sound deliverable.
Also distinguish one-time setup from repeat production. Preparing a template may make the first example slower while benefiting later projects. Conversely, a demonstration using a prepared template may look faster than a project that requires substantial adaptation. Measure both stages so the business case reflects the work your organization will perform.
4. Include the complete investment
Request current quotations for the selected software and any agreed services. Add internal effort for configuring fields, mapping incoming data, creating templates, testing outputs, training users, and managing the transition. Include deployment or technical-support requirements where they apply to your environment.
Separate initial costs from recurring costs. Initial costs may include setup, training, and historical-data preparation. Recurring costs may include applicable maintenance or subscription charges, administration, template updates, and support. Confirm the actual commercial terms rather than assuming a particular licensing model.
Decide how to treat existing data. Moving every historical record may be unnecessary for the first implementation, but omitting migration entirely can understate the effort needed for projects that rely on previous sampling rounds. Scope the minimum useful archive and record what will remain outside the initial workflow.
A hypothetical annual savings calculation
The following example uses invented planning assumptions, not GAEA pricing, measured customer results, or a performance guarantee. Assume a team produces 100 similar reports per year. Its baseline is 12 hours per report across the activities included in the study, at an internal labour cost of $70 per hour. The annual baseline is therefore 100 × 12 × $70 = $84,000.
Suppose a representative pilot supports a reduction of three hours per report after setup, while retaining the required review. That represents 300 hours per year and $21,000 of annual staff-capacity value. Assume, solely for illustration, $8,000 in additional recurring annual costs and a separate $15,000 initial implementation investment.
Under steady-state assumptions, net annual benefit would be $21,000 − $8,000 = $13,000. Dividing the $15,000 initial investment by that annual benefit gives a simple payback estimate of approximately 1.15 years, or about 14 months. This simplified calculation assumes full report volume and full benefit from the start, and excludes financing, tax, and discounting effects.
A more cautious first-year scenario might assume that only half of the annual capacity benefit is realized during rollout. That produces $10,500 of benefit against $8,000 of recurring cost and $15,000 of implementation cost: a first-year net position of −$12,500 on this model. Later full-year benefits may still justify the investment, but the ramp-up changes when the initial outlay is recovered.
Distinguish capacity value from cash savings
The hypothetical $21,000 benefit values released staff time. It does not automatically reduce payroll by $21,000. If the same staff remain employed for the same hours, the immediate benefit may be capacity to serve more projects, reduce a backlog, or devote additional time to interpretation and quality.
Cash savings require an identifiable change in expenditure, such as avoided overtime or external support that is no longer needed. Additional revenue requires available demand and a realistic way to use the released capacity. Keep these benefit types separate, and avoid counting the same hours both as a cost reduction and as fully realized new revenue.
For a consultancy, the effect can also depend on how work is priced. A shorter task does not produce the same commercial outcome under every contract arrangement. Ask the organization’s finance or operations lead to apply its own assumptions about utilization, fees, and delivery capacity.
Check the assumptions that drive the decision
Sensitivity analysis shows whether the conclusion is robust or depends on an optimistic estimate. In the example, one hour saved per report produces $7,000 of annual capacity value, two hours produces $14,000, and three hours produces $21,000. After the assumed $8,000 recurring cost, the corresponding annual net benefits are −$1,000, $6,000, and $13,000 before recovering the initial investment.
At three hours saved and $70 per hour, each eligible report contributes $210 of gross capacity value. Approximately 39 reports per year would cover the illustrative $8,000 recurring cost. That is a steady-state operating threshold; it does not recover the initial $15,000 investment or demonstrate a cash benefit.
Repeat the calculation for plausible changes in report volume, setup effort, and adoption. If only one project type benefits substantially, apply the benefit to that type rather than the whole portfolio. This identifies which assumptions need better pilot evidence before a purchase decision.
Use a pilot to replace estimates with evidence
Choose a representative project with source laboratory files, field context, and an approved comparison report. Recreate the proposed process and measure each activity using the same boundaries as the baseline. Include a correction or amended result so the exercise tests how the workflow handles change, not only a clean first pass.
Record the configuration already completed, the assistance provided, and the experience of the users. A specialist running a prepared example and a new user completing an unfamiliar task are different observations. Repeat selected tasks after familiarization where that helps distinguish training effects from recurring effort.
Acceptance should cover output quality as well as time. Check that records remain associated with the correct samples, relevant qualifiers and units are preserved, and the report agrees with reviewed information. Any time improvement that depends on omitting required checks should not be treated as an equivalent service.
Track benefits after implementation
Assign an owner to review the business case after the first production batches. Compare actual volume, preparation time, review effort, and ongoing administration with the assumptions. Record changes to laboratory formats or report requirements that affect the workflow. Update the model when the evidence changes.
Document useful nonfinancial outcomes separately, such as clearer source traceability, more consistent outputs, or easier handover between staff. Do not invent a monetary value for avoided errors or risk reduction without an accepted method and supporting evidence. A clear qualitative benefit is more credible than an unsupported financial claim.
To assess your own process, review the EDMS demonstration or request an environmental reporting consultation. Bring representative files, report templates, and a baseline of the work involved. A measured pilot and transparent assumptions provide a stronger business case for EDMS and E-ASR than a general promise of faster reporting.