
June 2019: The SE-Map component for mapping and gridding is now free in version 4 of GaeaSynergy. This component can grid and contour many types if data from borings, wells, cross-sections, samples, lab analyses and geotechnical test results. After the data has been entered in these optional modules it can be automatically extracted and used to generate contour maps.
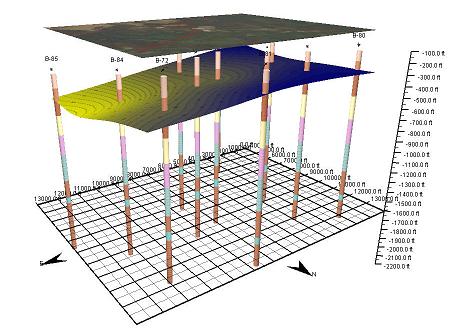
The data can be gridded with 6 different common gridding algorithms. After the contour map has been created it can be overlain on top of the project map. In addition, the contour map and any solids constructed from the top and bottom of strata can be displayed in 3D.
Below are some of the features of the mapping and gridding component:
- Diverse types of data can be shifted and merged
- Points in datasets can be edited and stored separately
- Statistics can be calculated on datasets
- Mathematical operations such as unit conversion, add, subtract, multiply, divide, filters, etc. can be applied to one or more datasets
- Data can be gridded using Natural Neighbor, Inverse Distance, Modified Sheppard, Minimum Curvature, Trend Surface, and Nearest Neighbor
- Grids can either cover the entire project area or a polygonal subset of the area
- Areas of grids can be blanked to represent zones of no data
- Mathematical operations can be performed on one or more grids
- Individual grid nodes can be edited
- Contour maps can be drawn with contour lines, color fill, or colored contour lines
- Individual contour levels can be edited
- Labels on contour lines can be easily moved and deleted