
In geotechnical engineering, understanding the “plasticity” of fine-grained soils is fundamental for predicting how they will behave under different moisture conditions. GAEA Technologies’ Geotechnical Data Management System (GDMS), part of the GaeaSynergy platform, simplifies this process by providing a standardized, digital environment for recording and reporting Atterberg Limits.
While ASTM D2487 (Unified Soil Classification System) is the overarching standard for classifying the soil based on these results, the physical testing typically follows ASTM D4318 procedures. Here is how you can seamlessly manage this test within GDMS.
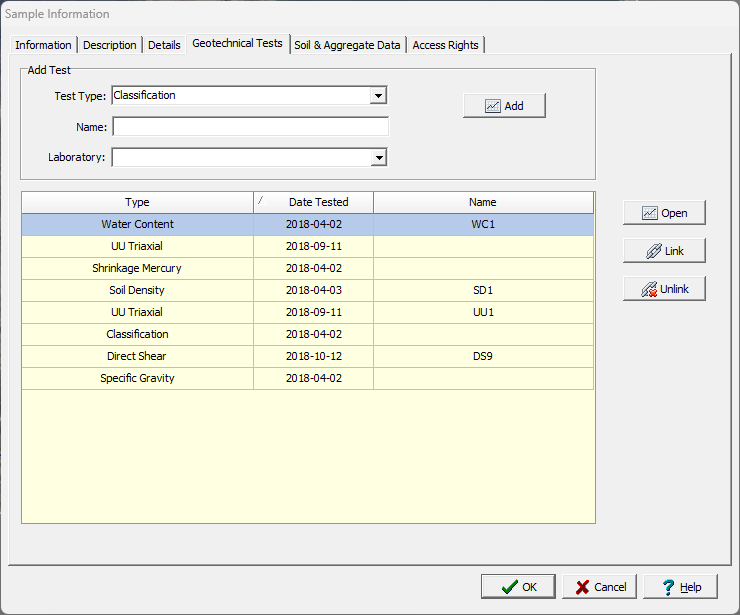
Step 1: Create a New Test for a Sample
Within your project, open the relevant sample and create a new Atterberg Limits test by going to the Geotechnical Tests tab and selecting the test type as Classification. The name and laboratory for the the analysis can also be specified. Then click on the Add button.
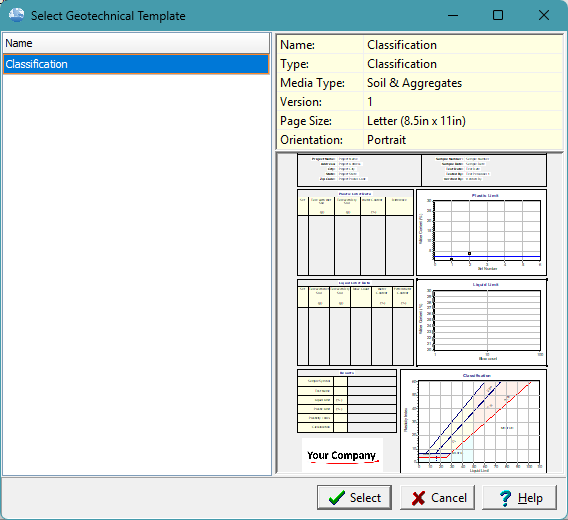
Step 2: Select the Template
The geotechnical template determines the format and layout for the test results.
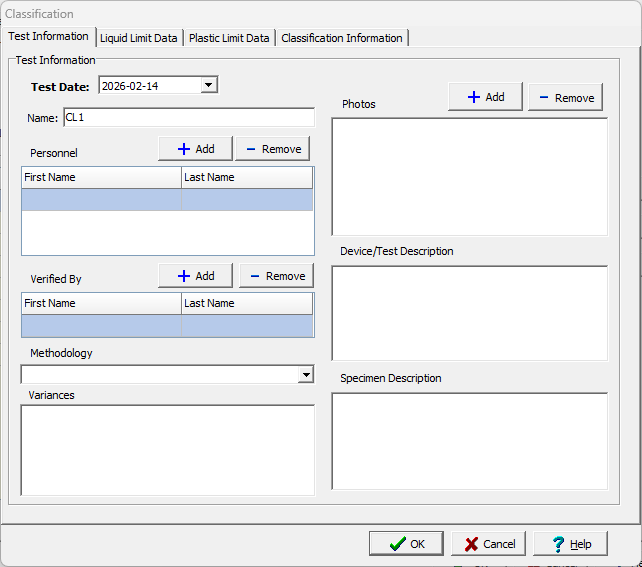
Step 3. Enter the Test Information
Enter critical metadata, including the test personnel, verifier, and links to photos of the test specimens if available.
Step 4: Enter Liquid Limit (LL) Data
The Liquid Limit is the moisture content at which soil begins to behave like a liquid.
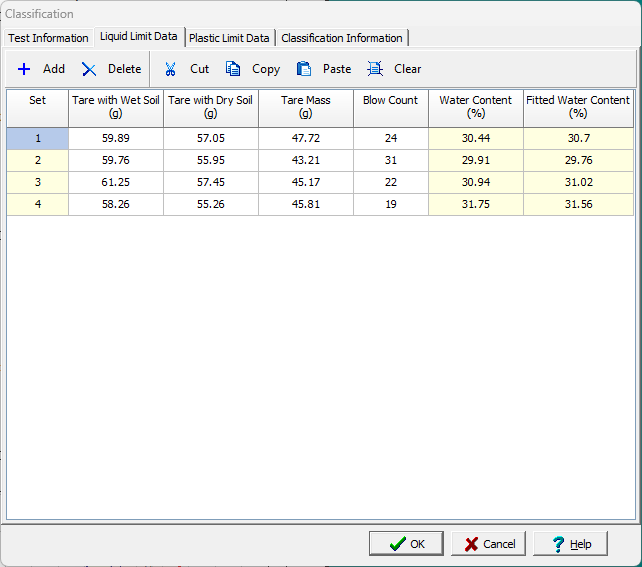
- Blow Counts: Record the number of blows (typically between 15 and 35) required for the groove in the Casagrande cup to close for a distance of 12.7 mm.
- Moisture Content: Enter the wet and dry weights for each trial. GDMS will automatically calculate the water content for each blow count.
Step 5: Record Plastic Limit (PL) Data
The Plastic Limit is the moisture content where the soil can no longer be rolled into a 3.2 mm (1/8 in) thread without crumbling.
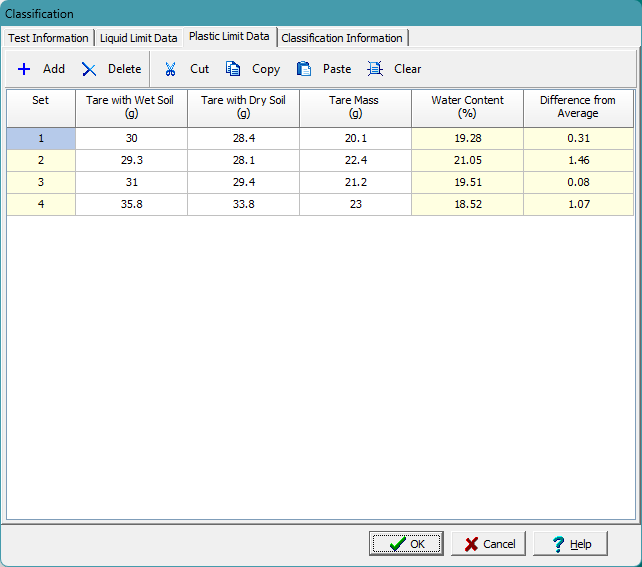
- Enter the mass data for your crumbled soil threads. GDMS typically averages at least two trials to determine the final PL.
Step 6: Automated Calculations & Graphing
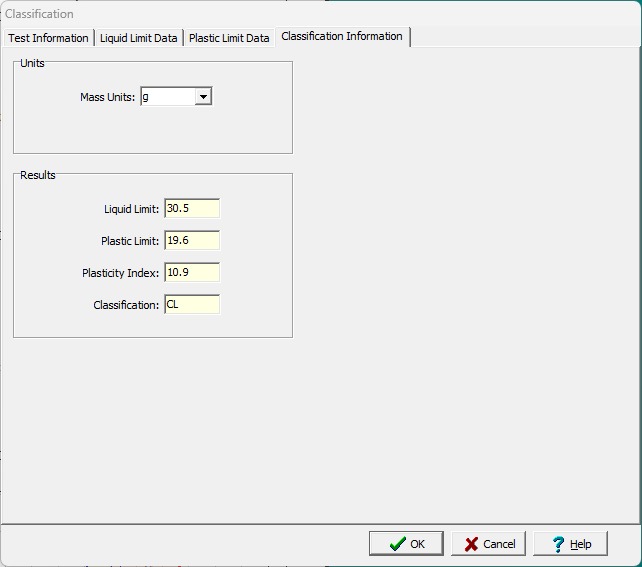
One of the primary benefits of GDMS is its real-time calculation engine.
- Plasticity Index (PI): The system automatically calculates
.
- Flow Curve: GDMS generates the semi-logarithmic “Flow Curve” (Water Content vs. Log of Blows), identifying the Liquid Limit at exactly 25 blows.
- Liquidity & Consistency: If you have entered the natural water content, GDMS can also calculate the Liquidity Index (LI) and Consistency Index (CI).
Step 7: Generate USCS Classification Reports
Based on the LL and PI results, GDMS uses the ASTM D2487 criteria to assign the correct Group Symbol (e.g., CL, CH, ML, MH) and Group Name. You can then export a professional report featuring:
- Standardized summary tables and plasticity charts.
- Automated headers with your corporate logo and project details.
Summary
Creating an Atterberg Limits test in GDMS transforms a manual, error-prone calculation process into an automated, auditable workflow. By integrating ASTM D2487 classification logic directly into the data entry form, the system ensures your geotechnical reports are accurate, standardized, and ready for submittal.
Related Articles
- Entering, Reporting, and Storing Geotechnical Tests in GDMS: A Complete Workflow Tutorial
- How Can I Use Project Views in GDMS to Display Geotechnical Test Tables and Charts?
- How Do I Create a Constant Head Permeability Test (ASTM D2434) in GDMS?
- How Do I Create a Proctor Compaction Test (ASTM D698/D1557) in GDMS?
- How Can I Perform a Sieve Analysis Using GDMS?