
If you are managing licenses across a team, keeping an eye on your network performance is crucial for maintaining data integrity and software speed. GaeaSynergy, developed by GAEA Technologies, includes a robust Network License Monitor utility designed to give administrators a clear view of how the software interacts with the database and the server.
Whether you are troubleshooting slow load times or auditing user access, here is your step-by-step guide to viewing and interpreting network usage.
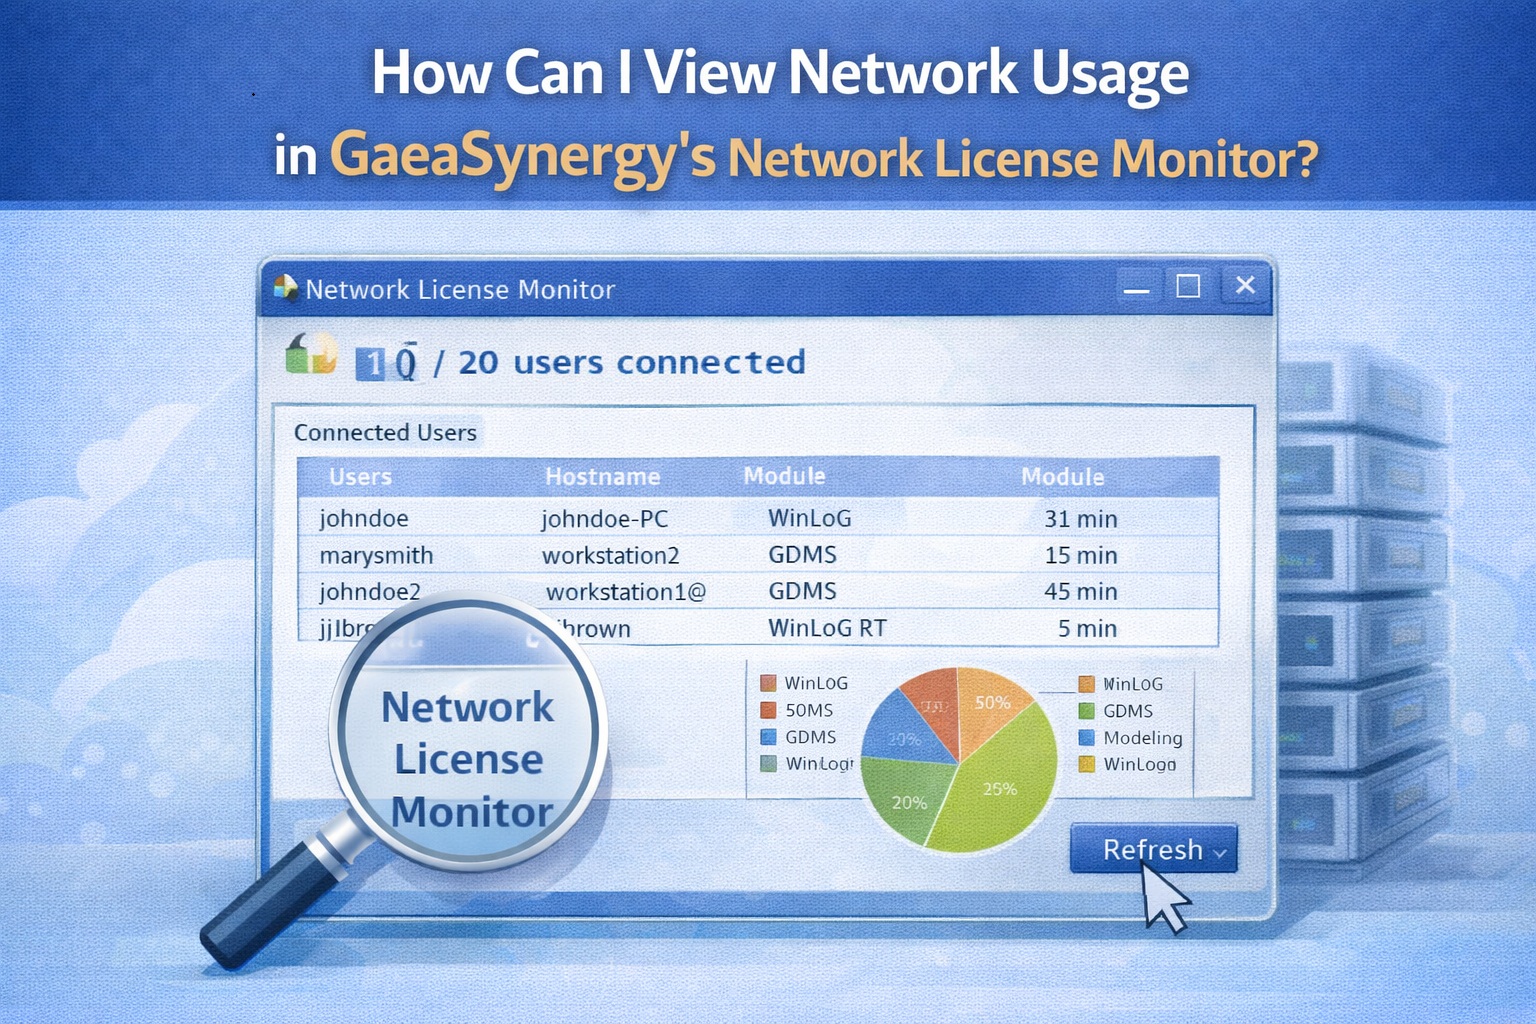
Accessing the Network License Monitor
The Network License Monitor isn’t always front-and-centre; it’s a specialized tool for administration. Open the license monitor using the desktop icon or from the going to GaeaSynergy and selecting Network License Monitor in the Start menu.
Ensure you have Administrative Privileges, as viewing global network usage often requires elevated permissions.
Once the monitor is open, you will see a real-time data feed. The main form shows who is currently logged into GaeaSynergy. If the network is lagging, check if an unusual number of users are performing heavy data imports or exports simultaneously.
Analyzing Graphical Usage History
For long-term performance optimization, the Network License Monitor provides a Graphical Usage History. To show a graphical history of the license usage click on the History button the Network Manager form, the License History form will be displayed. The graphical history can be used to view the license usage over time and determine if additional licenses should be acquired.
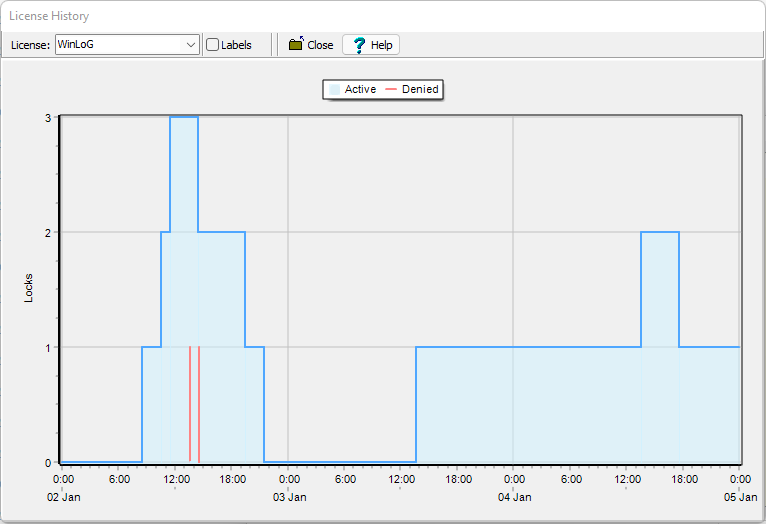
At the top of this form the module to display the license usage can be selected. In addition, labels can be displayed on the graph to show which user is obtaining and releasing the license. The license usage is shaded in blue and when a license is denied (usually because the maximum licenses are in use) a red line is displayed.
The vertical axis of the graph shows the number of locks and the horizontal axis shows the times and dates for the locks. The graph can be zoomed using the mouse wheel and the horizontal axis can be scrolled using the left mouse button.
Reviewing the Log of Network Events
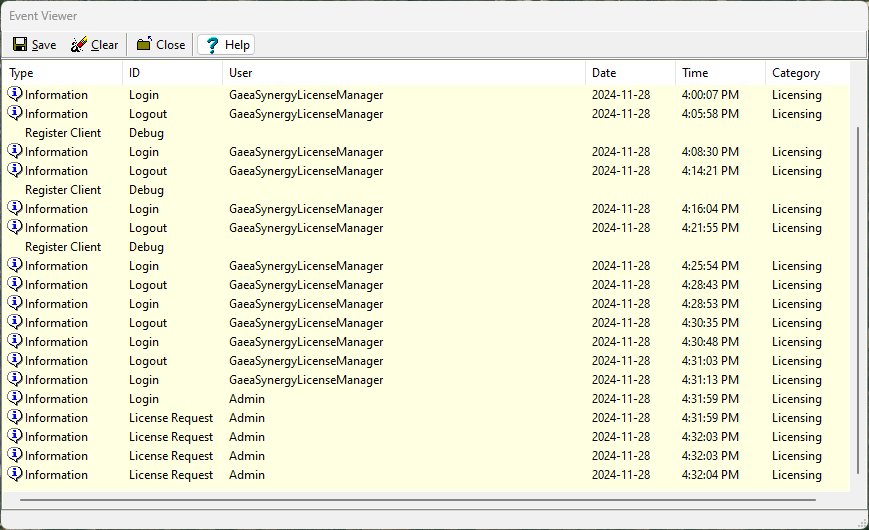
The Log of Network Events acts as the system’s “black box,” recording every critical interaction within the environment. To show a log of network events click on the Show Log button the Network License Manager form. Key features include:
- Detailed Event Tracking: The log records the type of event, the user, the user’s IP address, and the exact date and time it occurred.
- Security Auditing: Monitor the log for failed login attempts or unauthorized access requests to maintain data security.
- Troubleshooting: Review system and software errors chronologically to pinpoint the exact moment a service became unresponsive or a connection dropped.
- Exporting Data: In many administrative versions, these logs can be exported as XML files for external reporting and deep-dive analysis.
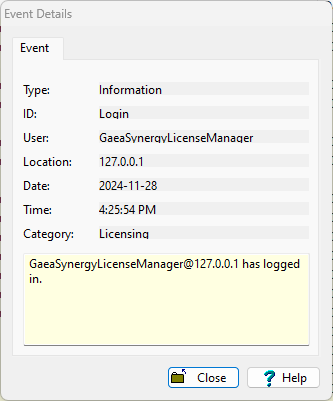
The details for an event can be displayed by double-clicking on the event in the list.
Summary
Viewing usage in the GaeaSynergy License Network Monitor is a straightforward process that involves analyzing the real-time dashboard for active users and data throughput. Monitoring these metrics regularly helps prevent system crashes and ensures that your environmental data remains synchronized across your organization.
Related Topics
- GaeaSynergy User Guide
- How Do I Update the Number of Users for the Network Version of GaeaSynergy and it’s Modules?
- Configuring User Privilege Levels & Password-Protected Projects in GaeaSynergy