
Introduction
Understanding how a contaminant plume behaves in groundwater is one of the most important skills in hydrogeology and environmental engineering. Whether you are working with analytical tools like POLLUTEv8 or complex numerical models, the ability to interpret plume behavior accurately determines how well you can assess risks, design remediation systems, and communicate findings.
A contaminant plume is not just a visual output—it is a dynamic representation of subsurface processes including advection, dispersion, sorption, and degradation. Interpreting it correctly requires both technical knowledge and practical insight.
This tutorial provides a comprehensive, step-by-step guide to interpreting plume behavior, helping you move beyond simply viewing model results to truly understanding what they mean.
1. What Is a Contaminant Plume?
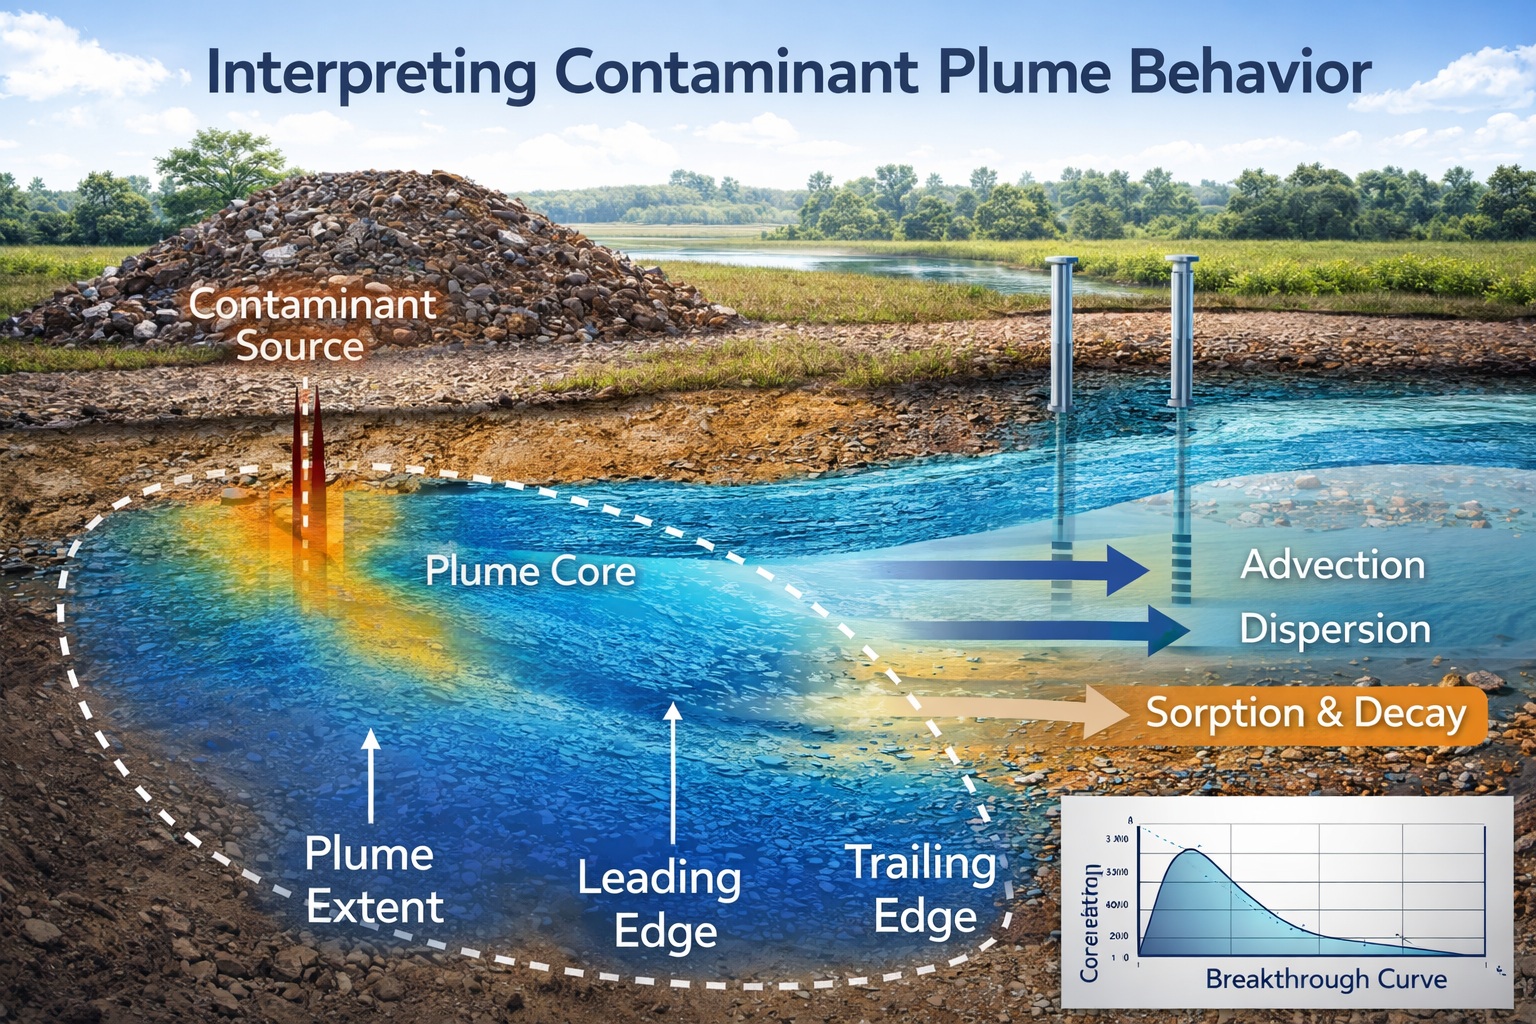
A contaminant plume is the spatial distribution of a pollutant within groundwater as it migrates away from a source zone.
Key Characteristics
- Source area – where contamination originates
- Plume core – highest concentration zone
- Leading edge – advancing front of contamination
- Trailing edge – area of declining concentration
Plumes evolve over time, influenced by hydrogeological and chemical processes.
2. Core Processes That Control Plume Behavior
To interpret plume behavior, you must understand the processes driving it.
Advection
- Movement of contaminants with groundwater flow
- Controls plume direction and speed
Dispersion
- Spreading caused by velocity variations
- Expands plume width and length
Diffusion
- Molecular mixing in low-flow zones
- Important in clays and stagnant areas
Sorption
- Contaminants attach to soil particles
- Slows plume migration (retardation)
Decay (Degradation)
- Chemical or biological breakdown
- Reduces concentration over time
3. Visualizing Plume Behavior
Plume behavior is typically visualized using:
Plan View Maps
- Show plume extent in horizontal space
- Useful for identifying affected areas
Cross-Sections
- Show vertical distribution
- Highlight stratigraphic controls
Time-Series Plots
- Show concentration changes over time
- Useful for monitoring wells
4. Interpreting Plume Shape
The shape of a plume reveals key information about subsurface conditions.
Narrow, Elongated Plume
- Indicates strong advection
- Low dispersion
Wide, Diffuse Plume
- High dispersion
- Possible heterogeneity
Irregular Shape
- Variable geology
- Preferential pathways
5. Understanding Plume Migration
Direction
Plume direction follows groundwater flow. Confirm that:
- It aligns with hydraulic gradient
- It matches field observations
Velocity
Evaluate how fast the plume is moving:
- Compare travel time to monitoring data
- Check consistency with hydraulic conductivity
6. Interpreting Concentration Levels
High Concentrations
- Close to source
- Limited attenuation
Decreasing Concentrations
- Due to dispersion, sorption, or decay
Threshold Exceedance
- Identify areas exceeding regulatory limits
7. Breakthrough Curve Interpretation
Breakthrough curves show concentration over time at a fixed location.
Key Features
- Arrival time – when contamination first appears
- Peak concentration – maximum level
- Tailing – persistence of low concentrations
What They Tell You
- Transport speed
- Attenuation processes
- Source behavior
8. Identifying Attenuation Processes
Natural Attenuation Indicators
- Declining concentrations over distance
- Reduced plume length over time
Sorption Effects
- Delayed arrival times
- Lower peak concentrations
Decay Effects
- Rapid concentration reduction
- Shorter plume
9. Evaluating Plume Stability
A key question in site assessment:
Is the plume:
- Expanding? → increasing risk
- Stable? → equilibrium
- Shrinking? → natural attenuation working
How to Determine
- Compare plume extent over time
- Analyze monitoring data trends
10. Role of Hydrogeology
Subsurface conditions strongly influence plume behavior.
Homogeneous Aquifer
- Predictable plume shape
- Smooth gradients
Heterogeneous Aquifer
- Irregular plume
- Preferential pathways
Layering Effects
- Vertical spreading limited or enhanced
- Contaminants may be trapped or redirected
11. Influence of Source Characteristics
Continuous Source
- Sustained plume
- Stable or growing
Pulse Source
- Plume dissipates over time
Variable Source
- Fluctuating concentrations
Understanding source history is critical for interpretation.
12. Common Interpretation Mistakes
Avoid these pitfalls:
- Assuming plume is symmetrical
- Ignoring vertical variability
- Overlooking data gaps
- Misinterpreting dispersion as dilution
- Assuming steady-state when conditions are changing
13. Using Plume Behavior for Risk Assessment
Plume interpretation directly informs risk evaluation.
Key Questions
- Will contamination reach receptors?
- When will it arrive?
- At what concentration?
Applications
- Drinking water protection
- Regulatory compliance
- Land-use planning
14. Interpreting Model vs. Field Data
Model Results
- Idealized
- Based on assumptions
Field Data
- Real-world variability
- Measurement uncertainty
Best Practice
Use both together:
- Validate models with field data
- Use models to fill data gaps
15. Sensitivity and Uncertainty
Plume behavior is influenced by uncertain parameters.
Key Variables
- Hydraulic conductivity
- Dispersivity
- Sorption coefficients
- Decay rates
Approach
- Test parameter ranges
- Evaluate impact on plume
16. Practical Workflow for Interpretation
- Review conceptual model
- Examine plume maps
- Analyze breakthrough curves
- Compare with monitoring data
- Identify controlling processes
- Assess risk
- Document findings
17. Case Study Example (Conceptual)
Scenario
- Contaminant: hydrocarbons
- Distance: 150 m
- Monitoring data available
Observations
- Plume length decreasing
- Peak concentrations declining
Interpretation
- Natural attenuation occurring
- Decay likely significant
- Risk decreasing over time
18. Communicating Plume Behavior
Clear communication is essential.
Use:
- Simple visuals
- Clear explanations
- Key metrics (distance, concentration, time)
Avoid:
- Overly technical language for non-experts
19. Best Practices
- Always link interpretation to data
- Consider multiple processes
- Validate assumptions
- Use multiple lines of evidence
- Document uncertainties
Conclusion
Interpreting plume behavior is both a science and an art. It requires understanding physical processes, analyzing data, and applying professional judgment. By carefully examining plume shape, migration, concentration trends, and controlling factors, you can extract meaningful insights that support environmental decision-making.
Whether using POLLUTEv8 or more advanced models, the principles remain the same: understand the system, analyze the data, and interpret results within the context of real-world conditions.
Mastering plume interpretation will elevate your ability to assess contamination, design solutions, and communicate findings effectively.