
Breakthrough curves are one of the most powerful tools in contaminant hydrogeology. Whether you’re assessing landfill leachate migration, evaluating remediation performance, or modeling groundwater contamination, a well-constructed breakthrough curve provides clear insight into how contaminants move through subsurface systems over time.
In 2026, the process goes beyond spreadsheets. With advanced tools like POLLUTE and MIGRATE, consultants can not only build breakthrough curves—but simulate, calibrate, and predict them with much higher confidence.
This guide walks through both the fundamentals and how to integrate modern modeling tools into your workflow.
What Is a Breakthrough Curve?
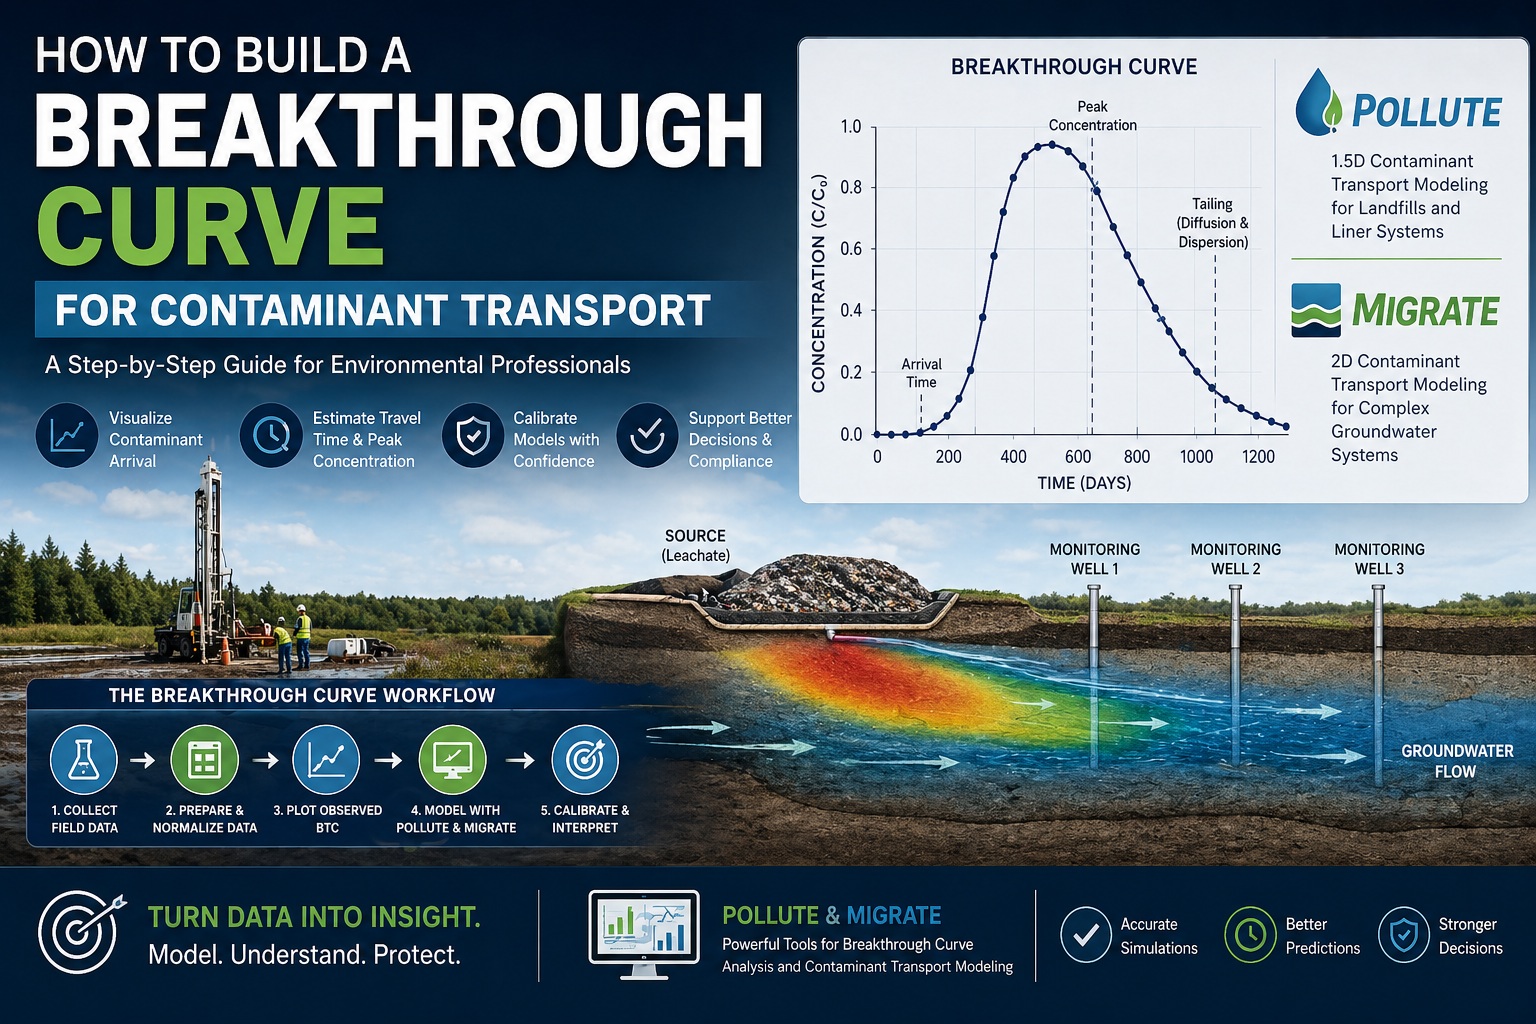
A breakthrough curve (BTC) is a graph showing contaminant concentration over time at a specific location (e.g., a monitoring well).
- X-axis: Time (days, months, years)
- Y-axis: Concentration (mg/L or normalized C/C₀)
It captures the full lifecycle of contaminant arrival:
- Initial detection
- Rising concentration
- Peak impact
- Long-term decline (tailing)
Why Breakthrough Curves Matter
Breakthrough curves are critical for:
- Predicting contaminant arrival times
- Estimating plume velocity
- Understanding attenuation and dispersion
- Calibrating transport models
- Supporting regulatory decisions
With tools like POLLUTE, BTCs become more than just plots—they become calibrated outputs tied directly to physical processes.
Key Processes That Shape a Breakthrough Curve
Understanding the physics behind BTCs is essential before building or modeling them.
1. Advection
Transport with groundwater flow.
2. Dispersion
Spreading due to velocity variations.
3. Diffusion
Movement from high to low concentration zones.
4. Retardation
Delay due to sorption.
5. Decay
Reduction from chemical/biological processes.
Why This Matters for Modeling
Both POLLUTE and MIGRATE explicitly simulate these processes—allowing you to match real-world BTCs with physically meaningful parameters.
Step 1: Collect High-Quality Field Data
A BTC starts with reliable monitoring data.
Required Inputs
- Time-series concentration data
- Sampling dates
- Source concentration (C₀)
- Hydrogeologic context
Where POLLUTE and MIGRATE Fit
While field data defines observed BTCs, POLLUTE and MIGRATE help:
- Fill gaps in monitoring data
- Test scenarios beyond measured conditions
- Validate conceptual models
Step 2: Prepare and Structure Your Data
Organize your dataset into time vs. concentration format.
| Time (days) | Concentration (mg/L) |
|---|---|
| 0 | 0 |
| 30 | 5 |
| 60 | 20 |
| 90 | 50 |
Best Practice
- Convert dates to elapsed time
- Standardize units
- Identify outliers
Modeling Advantage
Structured datasets can be directly compared against outputs from POLLUTE for calibration.
Step 3: Normalize Concentration
Normalization allows comparison across sites and scenarios.
C∗=C0C
Why It Matters
- Enables model calibration
- Removes dependency on source strength
- Helps compare multiple simulations
Both POLLUTE and MIGRATE commonly use normalized outputs for BTC comparison.
Step 4: Plot the Observed Breakthrough Curve
Plot concentration vs. time.
C(t)
Key Features
- Arrival time
- Peak concentration
- Tailing behavior
Where Modeling Enhances This Step
Instead of just plotting observed data, you can:
- Overlay modeled BTCs from POLLUTE
- Compare multiple scenarios
- Identify best-fit parameters
Step 5: Simulate Breakthrough Curves with POLLUTE
This is where workflows become significantly more powerful.
Why Use POLLUTE?
POLLUTE is specifically designed for:
- Vertical contaminant transport
- Landfill liner system analysis
- Time-varying source conditions
Breakthrough Curve Capabilities
- Generates BTCs at any depth or location
- Simulates time-dependent boundary conditions
- Models geomembrane and liner failure scenarios
Practical Example
You can simulate:
- Increasing leachate concentrations over time
- Delayed breakthrough due to liner systems
- Long-term tailing from diffusion
This is especially useful for landfill and containment system analysis.
Step 6: Expand to 2D Analysis with MIGRATE
When site conditions are more complex, 1D/1.5D models aren’t enough.
Why Use MIGRATE?
MIGRATE enables:
- Two-dimensional plume migration
- Multiple source zones
- Complex hydrogeologic conditions
Breakthrough Curve Applications
With MIGRATE, you can:
- Generate BTCs at multiple monitoring wells
- Simulate plume spreading across a site
- Evaluate spatial variability
Key Advantage
Unlike simple BTC plotting, MIGRATE allows you to understand:
Where contaminants go—not just when they arrive.
Step 7: Calibrate Model to Observed Data
Calibration is where modeling and field data come together.
Process
- Input site parameters into POLLUTE or MIGRATE
- Generate simulated BTC
- Compare with observed BTC
- Adjust parameters (velocity, dispersion, retardation)
Outcome
- Improved parameter estimates
- Better predictive capability
- Stronger regulatory defensibility
Step 8: Interpret and Apply Results
Once calibrated, BTCs become decision-making tools.
Insights You Can Extract
- Travel time to receptors
- Peak concentration timing
- Long-term contamination trends
With POLLUTE and MIGRATE
You can also:
- Run future scenarios
- Evaluate remediation strategies
- Predict system performance over decades
Real-World Example: Landfill Leachate Migration
Scenario
- Time-varying leachate source
- Composite liner system
- Downgradient monitoring well
Using POLLUTE
- Simulate vertical transport through liner
- Generate BTC at aquifer interface
Using MIGRATE
- Simulate plume spreading downgradient
- Generate BTCs at multiple wells
Result
A complete understanding of:
- When contamination arrives
- How it spreads
- How long it persists
Common Mistakes to Avoid
1. Relying Only on Observed Data
Without modeling, interpretation is limited.
2. Ignoring Time-Varying Sources
POLLUTE excels at handling these—use it.
3. Oversimplifying Site Conditions
Use MIGRATE when spatial variability matters.
4. Poor Calibration
Always match modeled BTCs to observed data.
Why POLLUTE and MIGRATE Are Essential in 2026
Modern environmental consulting requires more than plotting data.
With POLLUTE and MIGRATE, you can:
- Move from descriptive to predictive analysis
- Reduce uncertainty in contaminant transport
- Deliver defensible, high-value insights
Final Thoughts
Building a breakthrough curve is no longer just a graphing exercise—it’s a modeling-driven process.
The most effective workflows in 2026:
- Start with high-quality monitoring data
- Normalize and structure datasets
- Use POLLUTE for vertical and landfill-focused analysis
- Use MIGRATE for site-wide plume behavior
- Calibrate models to observed BTCs
- Use results to predict future conditions
If you’re still relying only on spreadsheets, you’re only seeing part of the picture.
Breakthrough curves, when combined with the right modeling tools, become one of the most powerful decision-making tools in environmental consulting.