
Managing complex environmental and geotechnical projects requires more than just data—it requires clarity, accessibility, and powerful visualization.
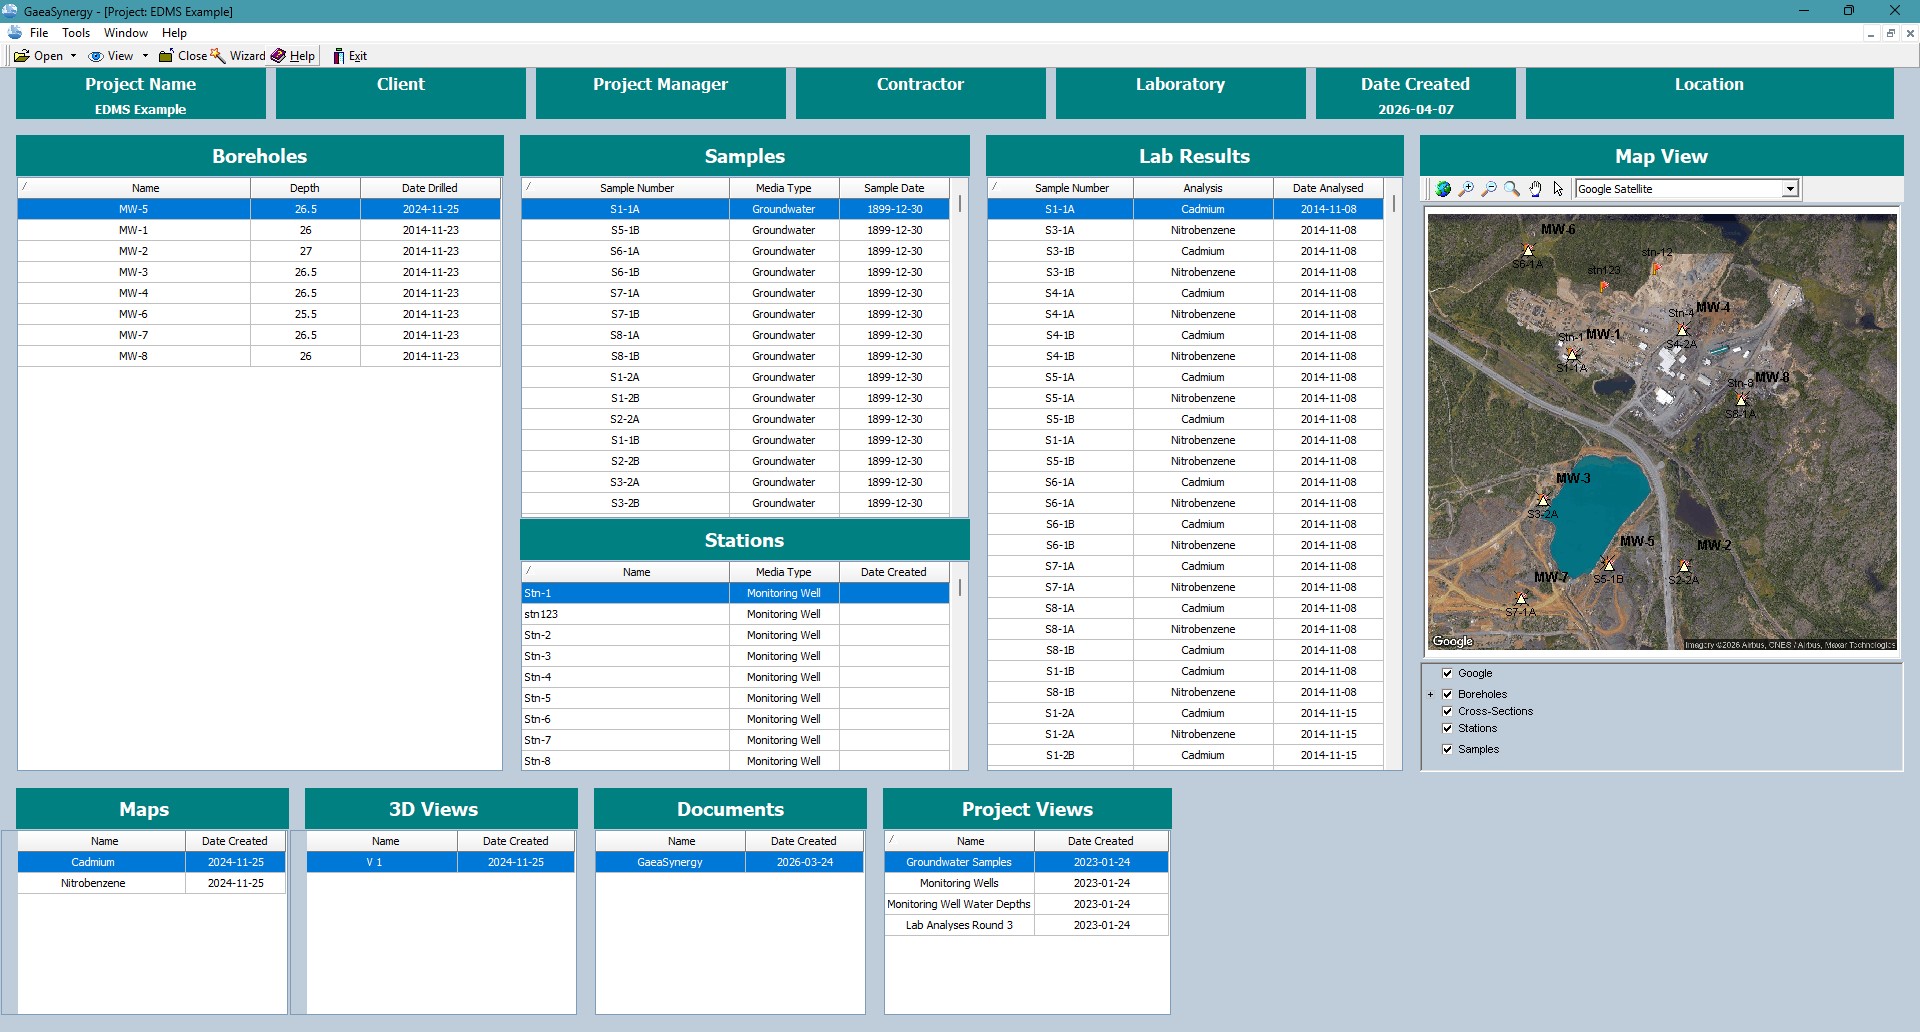
The new Project Dashboard in GaeaSynergy brings everything together in one unified interface, giving you a complete, real-time view of your project data—from boreholes to lab results and 3D models.
A Complete Project View in One Place
The Project Dashboard is designed to eliminate data silos by centralizing all project components into a single, easy-to-navigate workspace.
Whether you’re reviewing field data or analyzing subsurface conditions, everything is just a click away.
Interactive Project Map
The interactive project map provides a spatial overview of your site:
- Visualize boreholes, sample stations, and test locations
- Quickly navigate to specific data points
- Understand site conditions at a glance
This map serves as the central hub for accessing all project elements.
Boreholes, Sample Stations and Field Data
Access structured field data through organized lists:
- Boreholes – View logs, depths, and stratigraphy
- Sample Stations – Track sampling locations and details
- Field Records – Maintain accurate site documentation
This ensures all field data is consistent, searchable, and easy to manage.
Lab Results and Geotechnical Tests
Analyze testing data directly within the dashboard:
- Laboratory Results – Chemical and physical analysis
- Geotechnical Tests – Soil strength, classification, and properties
- Integrated data views for faster interpretation
No more switching between spreadsheets and reports—everything is centralized.
Cross-Sections, Maps and 3D Views
Bring your data to life with advanced visualization tools:
- Cross-Sections – Understand subsurface conditions
- Project Maps – Layered GIS visualization
- 3D Views – Explore site data in three dimensions
These tools help transform raw data into meaningful insights.
Documents and Project Files
Keep all project documentation organized and accessible:
- Upload and manage reports, drawings, and files
- Maintain version control
- Ensure team-wide access to critical documents
Project Views for Better Insights
The dashboard includes flexible project views to help you analyze and organize your data:
- Filter and sort by data type
- Customize views based on workflow
- Quickly locate specific datasets
This allows users to tailor the dashboard to their specific needs.
Built for Environmental and Geotechnical Professionals
The GaeaSynergy Project Dashboard is designed for:
- Environmental consultants
- Geotechnical engineers
- Hydrogeologists
- Project managers
It supports real-world workflows, from field data collection to advanced analysis and reporting.
Key Benefits
- Centralized project data
- Interactive spatial visualization
- Integrated lab and test results
- Advanced 2D and 3D analysis tools
- Streamlined document management
- Faster decision-making
Transform Your Project Workflow
The new Project Dashboard in GaeaSynergy empowers your team to move from data collection to insight generation faster than ever before.
With everything connected in one platform, you can focus on what matters most—delivering accurate, efficient, and high-quality project outcomes.
Get Started with GaeaSynergy
Start using the new Project Dashboard and experience a smarter way to manage environmental and geotechnical projects.