
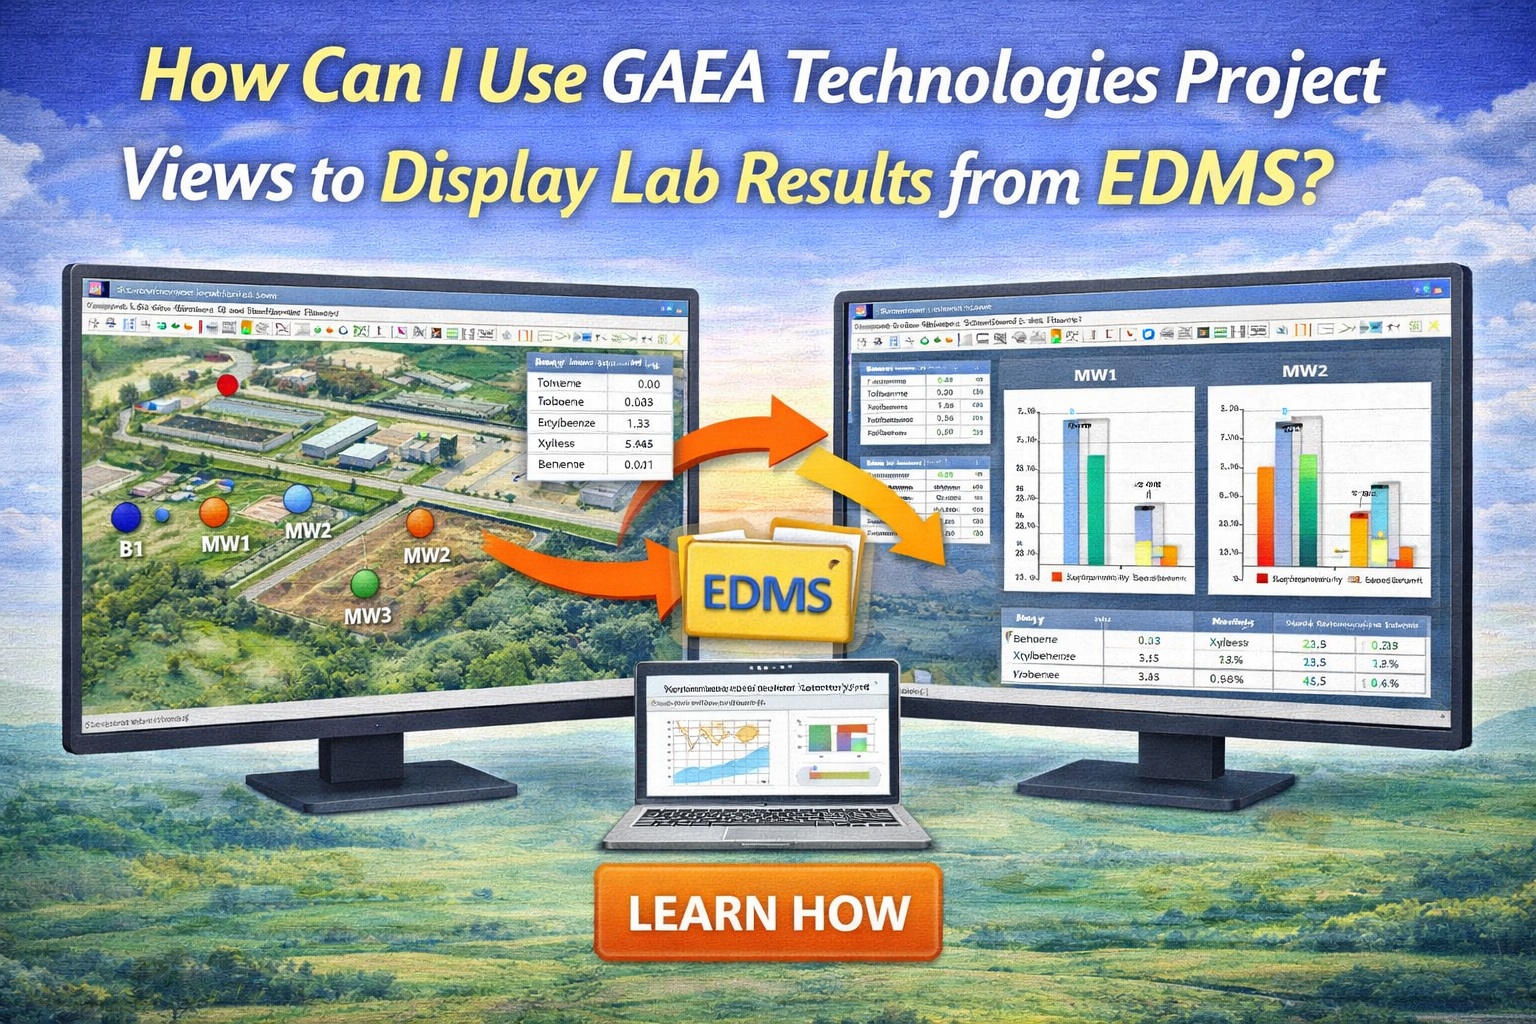
In the GAEA Technologies Environmental Data Management System (EDMS), project views serve as a critical bridge between raw laboratory data and professional environmental reporting. The system uses integrated tables and charts to transform Electronic Data Interchange (EDI) files into actionable visual insights.
The creation and editing of project templates is covered in detail in the blog “How to Create and Edit Project Templates”.
Data Integration via Tables
Tables in EDMS are not just static displays; they are dynamic tools for data collation and compliance monitoring.
- Customizable Reporting: You can collate sample and lab analysis results into a variety of tables that can be easily customized for internal audits or external regulatory submissions.
- Regulatory Comparison: By checking the “Display Limit” box in the Results Tab, you can instantly compare analytical data against pre-stored regulatory standards within the table view.
- Unified Field & Lab Data: EDMS allows you to link field data (like pH or temperature) with lab results so they appear on a single line in exported chemistry tables, ensuring a comprehensive view of the sampling event.
Analytical Visualization through Charts
Charts in EDMS provide a spatial and temporal context that tables alone cannot offer.
- Trend Analysis: The system generates graphs to track concentration changes over time, helping to identify plumes or seasonal fluctuations.
- Spatial Contouring: Integrated with the Map module in GaeaSynergy, lab results can be used for gridding and contouring, allowing you to visualize groundwater concentrations across a site.
- Subsurface Modeling: Because EDMS is part of the GaeaSynergy platform, lab data is seamlessly available for 2D and 3D cross-sections in modules like WinFence and WinLoG, where it can be displayed alongside borehole logs.
Summary
GAEA Technologies’ EDMS simplifies lab result management by using EDI for automated data import and Project Views for customized visualization. By configuring viewpoints and using integrated tools like contour maps and charts, environmental professionals can transform raw lab data into actionable project insights.