

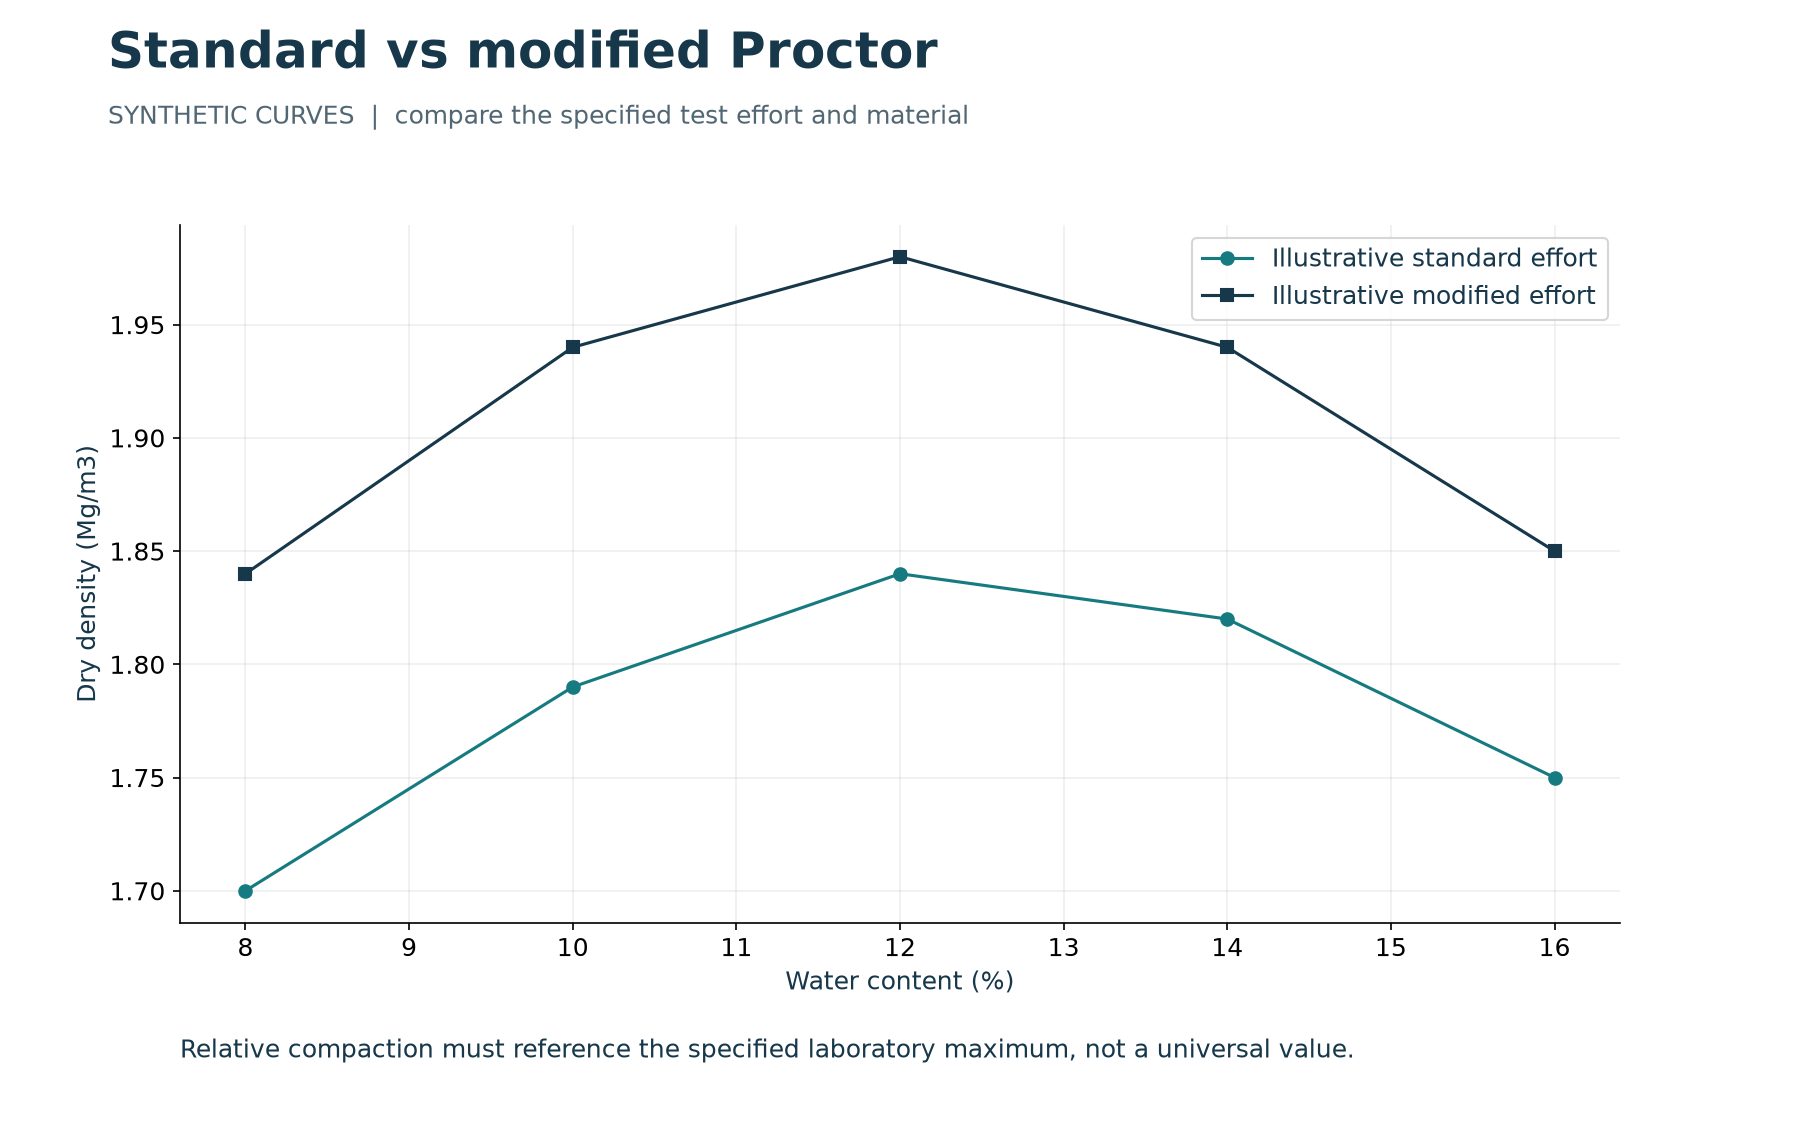
Standard and modified Proctor tests establish laboratory relationships between water content and dry density at specified compactive efforts. Their results are often used as reference values for earthwork control. The important difference is the prescribed test effort and procedure, not simply whether one test produces a larger density number. The project specification determines which reference is appropriate.
This guide explains the comparison and provides synthetic compaction curves, a dry-density calculation and an example of relative compaction. It is intended to help readers understand reports and organize data. It does not replace the governing standard, laboratory procedure or project acceptance requirements.
Download the curves and example data
Use the worked-examples reference (PDF) for a printable comparison. The learning examples pack includes a CSV with the plotted water contents and dry densities. These values are invented and do not represent a tested material. The curves illustrate data relationships, not a recommended construction target.
The key difference is compactive effort
ASTM D698 covers standard effort, approximately 600 kN-m/m3. ASTM D1557 covers modified effort, approximately 2,700 kN-m/m3. The modified procedure applies substantially greater energy per unit volume. Apparatus, method selection, specimen preparation and execution must follow the relevant standard.
Do not combine details from the two procedures to create an informal hybrid test. The mould, rammer, drop, layers and blows are part of a defined method, with choices depending on the material and applicable procedure. Confirm the current project-specified edition and the laboratory’s controlled method before testing. A short web comparison cannot reproduce all of those requirements.
Understand a compaction curve
A compaction curve plots dry density against water content. Individual specimens are prepared and compacted at different water contents using the specified effort. The resulting measurements define the relationship over the tested range. The maximum dry density and corresponding optimum water content are interpreted from an appropriate curve, subject to the method and the quality of the observations.
For many soils, greater effort produces a higher maximum dry density and a lower optimum water content, but the response depends on the material. Do not treat a typical trend as a guaranteed conversion between tests. Two reference curves must be established and interpreted appropriately. A fixed multiplier cannot reliably turn every standard Proctor result into a modified Proctor result.
Convert moist density to dry density
The dry-density relationship is rho dry = rho moist / (1 + w), where w is water content expressed as a decimal. Suppose the measured moist density is 2.06 Mg/m3 and the water content is 12 percent. Enter w as 0.12, not 12. The dry density is 2.06 / 1.12 = approximately 1.839 Mg/m3.
Keep the measured quantities and units in the record. Density expressed in Mg/m3 and unit weight expressed in kN/m3 are related but are not interchangeable labels. If a report uses unit weight, apply the appropriate conversion consistently. Errors involving percent-versus-decimal water content or mismatched units can distort an otherwise reasonable-looking curve.
Read the synthetic example carefully
The standard-effort example uses water contents of 8, 10, 12, 14 and 16 percent with dry densities of 1.70, 1.79, 1.84, 1.82 and 1.75 Mg/m3. The modified-effort illustration uses 1.84, 1.94, 1.98, 1.94 and 1.85 Mg/m3 at the same water contents. The values are deliberately simple and show two different density relationships without claiming to model a particular soil.
The highest sampled value is not automatically the final reported maximum for a real test. Review the shape, spacing and coverage of the measurements and follow the method’s evaluation requirements. If the tested range does not adequately bracket the peak, more work may be needed. Do not extrapolate a preferred maximum from an incomplete series merely to finish the report.
Calculate relative compaction with the correct reference
Relative compaction is commonly expressed as field dry density divided by the specified laboratory maximum dry density, multiplied by 100. Using the synthetic standard reference of 1.84 Mg/m3 and a hypothetical field dry density of 1.75 Mg/m3 gives 1.75 / 1.84 x 100 = approximately 95.1 percent. This example demonstrates arithmetic only.
Changing the reference changes the percentage. Using 1.98 Mg/m3 in the denominator would give approximately 88.4 percent for the same field density. That difference is why a percentage without the associated laboratory method and material reference is incomplete. No pass/fail conclusion is implied here. Acceptance may also involve moisture conditions, lift requirements and other project-specific criteria.
Match the laboratory specimen to the field material
A reliable comparison needs an appropriate material match. Review the source, grading, preparation and identification of the specimen used for the reference curve. If the field material changes, a historical reference may no longer represent the placed material. Oversize particles and specimen preparation require treatment under the relevant procedure rather than an undocumented adjustment.
Retain the link between the source material, laboratory test, field location and report. A convenient filename such as Proctor-final is not enough to establish that relationship. Reviewers should be able to determine which reference was applied to each field result and why. If a reference is superseded, identify which calculations or reports need reconsideration.
Recognize common reporting problems
Check for water contents entered as whole numbers in decimal formulas, density and unit-weight labels mixed together, or curves assembled from different specimens without explanation. Investigate abrupt changes in the curve, unexplained excluded points and maxima that depend on excessive extrapolation. Preserve the measurements even when a result requires qualification or repeat testing.
Do not make an acceptance statement solely because a rounded percentage reaches a familiar threshold. Use the actual specification, required precision and approved decision rules. The report should identify the method, sample, curve, reference maximum and relevant limitations clearly enough for another qualified person to review the conclusion.
Use software to make the process reproducible
A controlled software workflow should retain original masses or density measurements, water-content determinations, calculated dry densities and the report configuration. Review the output against a hand-checked example before adopting a new template. When an input changes, verify the calculation, curve and issued summary together.
GAEA’s GDMS Proctor tutorial explains the application workflow. Confirm supported methods and settings for the installed version. The useful result is a report that can be traced back to its measurements and reproduced, with the laboratory and project reviewer retaining responsibility for method selection and acceptance.