
Finding Hidden Data Quality Issues Before They Become Costly Problems
Geological and geotechnical databases often contain millions of records collected over many years by multiple organizations, drilling contractors, geologists, laboratory technicians, and field personnel. While validation rules can identify obvious errors such as negative depths, overlapping intervals, or missing coordinates, many data quality issues are far more subtle.
A recovery value of 150% is clearly invalid and can be detected using a simple rule. However, what about a recovery value of 98% in highly weathered rock where nearby intervals average only 40%? Or an assay result that is technically within an acceptable range but significantly different from surrounding samples?
These situations are known as statistical outliers.
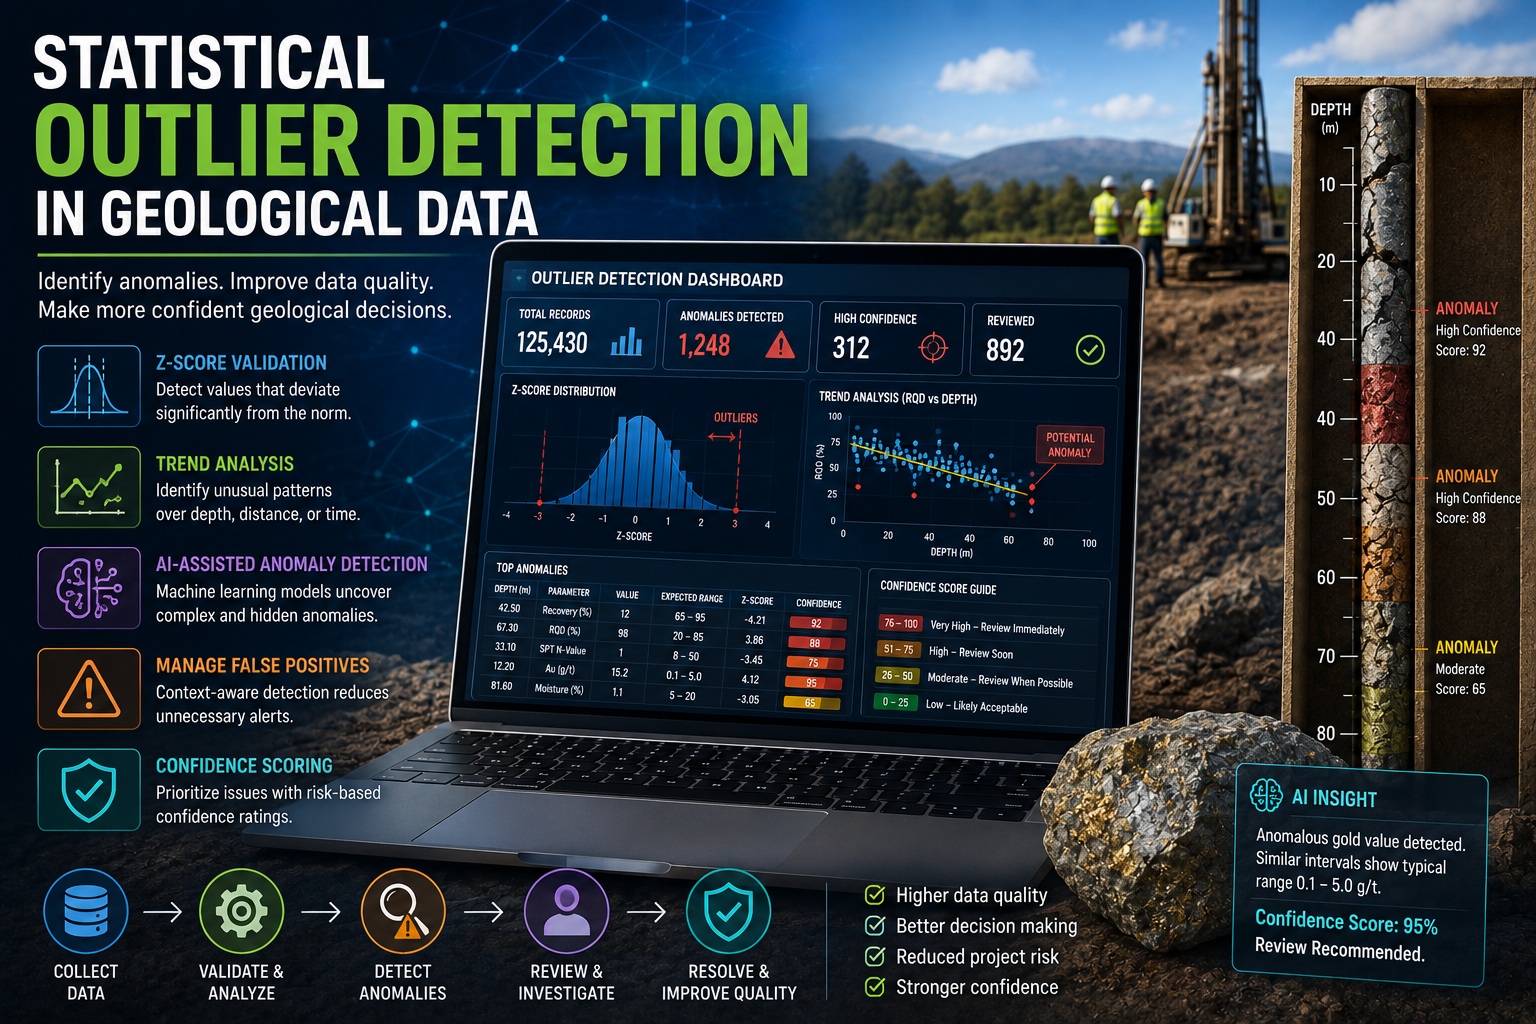
Outlier detection is an advanced quality control technique that identifies unusual values that deviate significantly from expected patterns. Modern geological database systems increasingly use statistical methods, trend analysis, and artificial intelligence to detect anomalies automatically and help organizations improve data quality.
This article explores statistical outlier detection techniques in geological data, including Z-score validation, trend analysis, AI-assisted anomaly detection, managing false positives, and confidence scoring.
What Is an Outlier?
An outlier is a value that differs significantly from other observations within a dataset.
Outliers may represent:
- Data entry errors
- Measurement errors
- Unit conversion mistakes
- Laboratory issues
- Geological anomalies
- Exceptional but valid conditions
The challenge is determining which category applies.
For example:
| Recovery (%) |
|---|
| 75 |
| 78 |
| 80 |
| 82 |
| 77 |
| 79 |
| 81 |
| 35 |
The value of 35% stands out immediately.
The low value may indicate:
- A logging mistake
- A drilling problem
- Faulted ground conditions
- Highly fractured rock
The purpose of outlier detection is not to automatically reject unusual values but to identify records that deserve further review.
Why Outlier Detection Matters
Many geological datasets contain errors that appear reasonable when viewed individually.
Examples include:
- A collar elevation entered as 1520 m instead of 1250 m
- Recovery entered as 89 instead of 98
- Laboratory values recorded using incorrect units
- Coordinates shifted by a projection error
- Depth intervals assigned to the wrong borehole
These values may pass traditional validation checks.
Outlier analysis helps detect these hidden issues by examining how values compare to surrounding records and historical trends.
Benefits include:
- Improved data quality
- Earlier error detection
- Reduced review effort
- Better resource modeling
- More reliable geotechnical interpretations
- Greater confidence in reporting
Z-Score Validation
One of the most widely used statistical methods for outlier detection is the Z-score.
A Z-score measures how far a value deviates from the average relative to the dataset’s standard deviation.
The basic concept is:
- Values near the average have low Z-scores
- Unusual values have high Z-scores
A common threshold is:
z > 3
Values with an absolute Z-score greater than 3 are often considered potential outliers.
Example: Recovery Data
Consider the following recovery percentages:
| Recovery |
| 82 |
| 84 |
| 81 |
| 79 |
| 85 |
| 83 |
| 80 |
| 45 |
The value of 45% differs substantially from the rest of the dataset.
A Z-score calculation would likely flag this value for review.
The system might generate:
Warning R-400: Statistical Outlier Detected
This does not necessarily mean the value is wrong, only that it deserves investigation.
Example: Laboratory Results
Outlier detection is commonly applied to:
- Assays
- Moisture content
- Density measurements
- Atterberg limits
- Permeability tests
- UCS results
An unusually high laboratory value may indicate:
- Sample contamination
- Incorrect units
- Transcription errors
- Genuine geological variation
Review is required before conclusions are drawn.
Trend Analysis
While Z-scores evaluate individual values, trend analysis examines how measurements change over depth, distance, or time.
Trend analysis is particularly valuable in geological datasets because many properties vary gradually rather than randomly.
Depth-Based Trends
Consider RQD measurements:
| Depth | RQD |
| 10 m | 82 |
| 11 m | 79 |
| 12 m | 81 |
| 13 m | 84 |
| 14 m | 8 |
| 15 m | 80 |
The sudden drop at 14 m may indicate:
- Logging error
- Core box mix-up
- Fault zone
- Major geological contact
Trend analysis identifies the abrupt change and flags it for review.
Spatial Trends
Coordinates and geological attributes often exhibit spatial continuity.
Examples include:
- Groundwater elevations
- Soil thickness
- Rock quality
- Geochemistry
- Contaminant concentrations
A single borehole reporting values dramatically different from neighboring holes may indicate a problem.
Spatial trend analysis can detect:
- Coordinate errors
- Sample mix-ups
- Incorrect laboratory results
- Geological anomalies
Temporal Trends
Projects spanning months or years may reveal trends over time.
Examples:
- Water level changes
- Instrument readings
- Settlement measurements
- Monitoring data
Trend analysis can identify:
- Instrument failures
- Sensor drift
- Data corruption
- Unexpected site conditions
AI-Assisted Anomaly Detection
Traditional statistical methods work well for simple datasets, but geological data often contains complex relationships.
Modern AI techniques can identify anomalies that conventional rules may miss.
Beyond Single Values
Artificial intelligence can evaluate multiple variables simultaneously.
Examples include:
- Lithology
- Recovery
- RQD
- Depth
- Coordinates
- Laboratory results
- Drilling methods
Instead of examining one field at a time, AI evaluates the entire context.
Pattern Recognition
Machine learning models can learn normal project behavior.
For example, the system may recognize that:
- Competent granite typically has high recovery
- Soft clay usually has low SPT values
- Certain lithologies correspond to expected density ranges
When new data differs significantly from learned patterns, the system can raise an alert.
Multi-Dataset Validation
AI is particularly effective when evaluating relationships between datasets.
Examples:
- Recovery vs RQD
- Lithology vs SPT values
- Well construction vs geology
- Coordinates vs project boundaries
The system can identify inconsistencies that may not be obvious through simple rule-based validation.
False Positives
One of the biggest challenges in outlier detection is avoiding excessive false positives.
A false positive occurs when a valid value is incorrectly identified as suspicious.
Geological Data Is Naturally Variable
Unlike manufacturing processes, geological conditions are inherently irregular.
Examples include:
- Fault zones
- Ore bodies
- Karst features
- Boulders
- Fractured rock
- Contaminated zones
These conditions can produce genuine outliers.
A low recovery interval within a fault zone may be entirely correct.
An unusually high assay value may represent a valuable mineralized zone.
Automatically rejecting such values would be a serious mistake.
Warnings Instead of Errors
For this reason, statistical outliers are generally classified as warnings rather than errors.
Example:
| Validation Type | Result |
| Negative depth | Error |
| Overlapping intervals | Error |
| Statistical anomaly | Warning |
This approach allows experts to review unusual records without unnecessarily blocking workflow progress.
Reducing False Positives
Several techniques help improve accuracy:
Contextual Validation
Compare values only within similar geological units.
Depth Windows
Compare nearby intervals rather than the entire dataset.
Project-Specific Thresholds
Adjust sensitivity based on site conditions.
Multi-Factor Analysis
Consider multiple variables simultaneously.
These approaches significantly reduce unnecessary alerts.
Confidence Scoring
Modern validation systems increasingly use confidence scoring to prioritize issues.
Rather than simply flagging an outlier, the system estimates how likely the anomaly is to represent a genuine problem.
What Is Confidence Scoring?
Confidence scores typically range from:
| Score | Interpretation |
| 0–25 | Low concern |
| 26–50 | Moderate concern |
| 51–75 | High concern |
| 76–100 | Very high concern |
Higher scores indicate greater probability that the record requires investigation.
Example
Suppose a recovery value of 40% occurs:
Scenario 1
- Highly fractured rock
- Nearby intervals similar
Confidence Score: 25
Likely valid.
Scenario 2
- Competent granite
- Nearby intervals average 95%
Confidence Score: 90
Likely data quality issue.
The confidence score helps reviewers prioritize their efforts.
Workflow Integration
Confidence scoring works best when integrated directly into QA/QC dashboards.
Reviewers can:
- Sort by confidence score
- Focus on highest-risk records
- Resolve issues more efficiently
- Reduce review time
This allows large projects to concentrate resources where they are most needed.
Best Practices for Implementing Outlier Detection
Organizations should follow several best practices when implementing statistical validation.
Use Multiple Detection Methods
Do not rely solely on Z-scores.
Combine:
- Statistical analysis
- Trend analysis
- Rule-based validation
- AI-assisted detection
Treat Outliers as Review Candidates
Outliers should trigger investigation, not automatic rejection.
Human expertise remains essential.
Provide Clear Explanations
Users should understand:
- Why a record was flagged
- Which values contributed
- How unusual the condition is
Transparency improves trust in the system.
Track Resolution History
Maintain an audit trail showing:
- Detection date
- Confidence score
- Reviewer comments
- Resolution status
This supports continuous improvement of validation models.
Conclusion
Statistical outlier detection is becoming an increasingly important component of geological and geotechnical data quality management. While traditional validation rules remain essential for identifying obvious errors, advanced techniques such as Z-score validation, trend analysis, AI-assisted anomaly detection, and confidence scoring help uncover subtle issues that might otherwise remain hidden. When implemented correctly, these methods improve data quality, reduce review effort, support better decision-making, and increase confidence in geological interpretations. Most importantly, they enable organizations to identify potential problems early, before those issues affect resource models, engineering designs, environmental assessments, or regulatory reporting.