


Asphalt Marshall Stability
Stability, flow, specimen measurements and load-deformation results.


GDMS connects test-specific laboratory workflows with structured project and sample records for soil, aggregate, concrete, asphalt and rock testing.
Keep source measurements with calculated results, engineering curves and standardized reports—without relying on disconnected spreadsheets.
Move directly to detailed capabilities, supported test workflows, example reports, migration guidance, common questions or licensing.
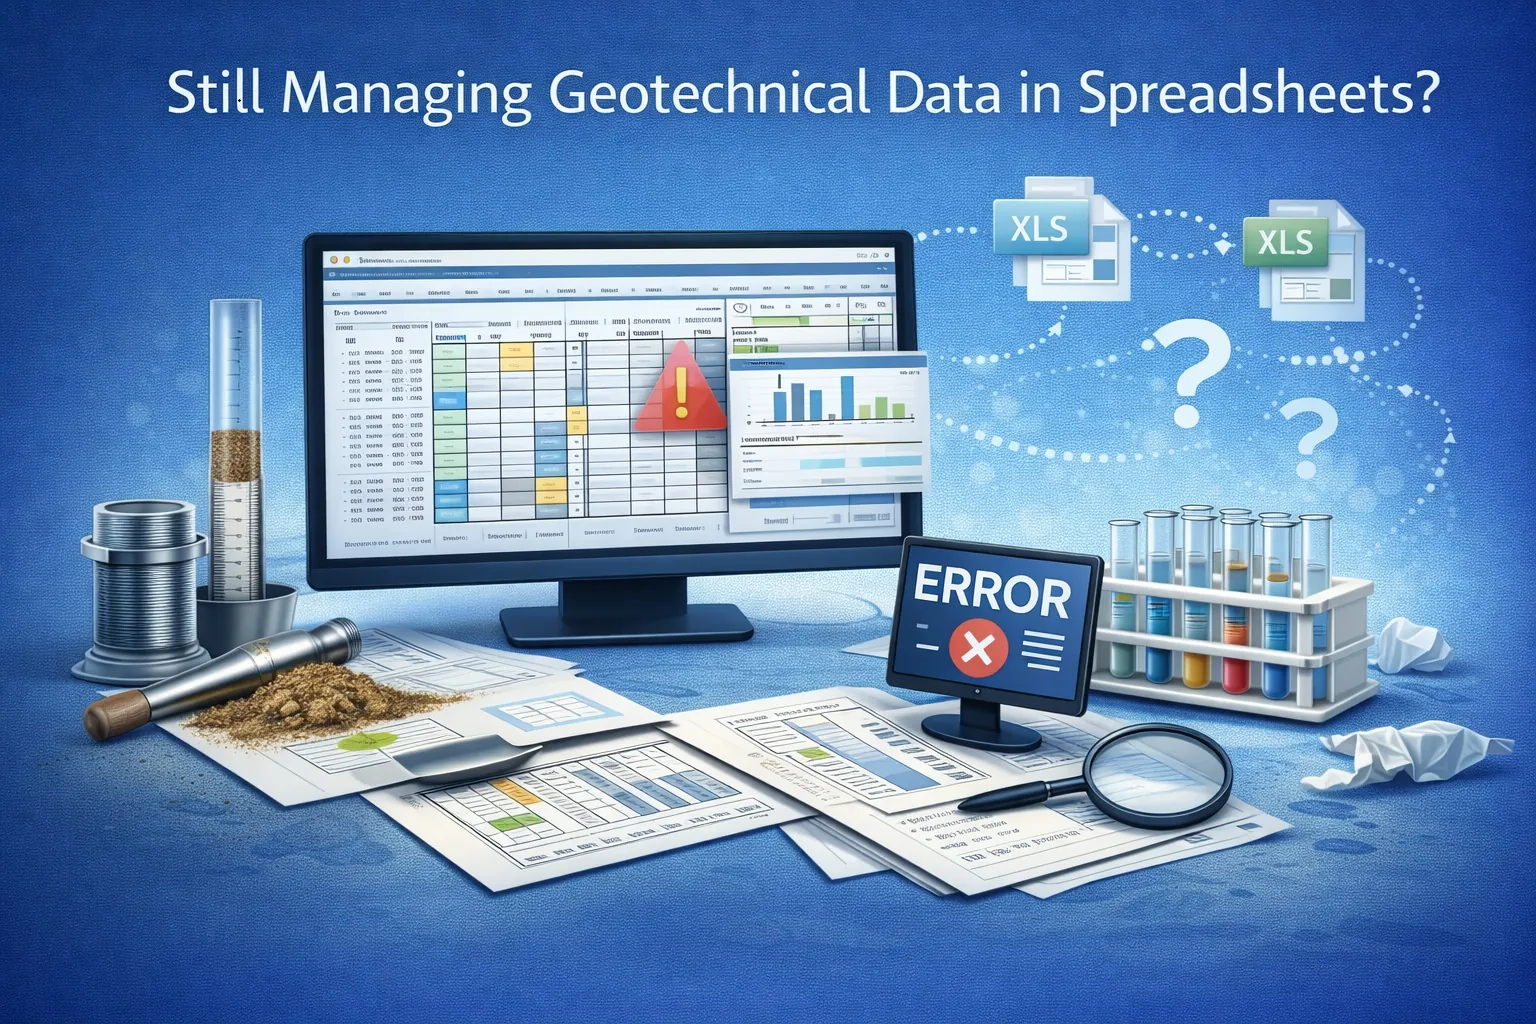
Individual spreadsheets may calculate one test, but they often separate measurements, formulas, plots, reports and historical records.
GDMS combines practical test processing with structured records that remain useful after the report is issued.
Organize tests by project, sample, material, specimen and test type in a managed database.
Derive applicable engineering values from recorded measurements using repeatable workflows.
Generate the calculations, classifications, tables and graphs required by the selected test.
Review specimen details, units, required inputs, calculations and exceptions before reporting.
Produce consistent result sheets while retaining the connection to the supporting test data.
Keep laboratory information available within the wider project environment where licensed.
Test forms, inputs, calculations and outputs are organized according to the applicable material and engineering workflow.
Examples include grain size, Atterberg limits, moisture, specific gravity, compaction, CBR, permeability, consolidation, direct shear and compression testing.
Manage compressive, flexural and splitting-tensile workflows with specimen measurements and calculated strength results.
Workflows include bitumen content, viscosity, bulk and maximum specific gravity, nuclear density and Marshall stability.
Manage rock water content, point-load strength, unconfined compression and triaxial compression results.
Separate the laboratory workflow provided by GDMS from the wider project context and the professional responsibilities of the laboratory.
GDMS has its own product and licensing path for laboratories that need managed geotechnical test data, calculations and reports.
GDMS supports structured laboratory workflows and calculations. Software use by itself does not establish compliance with a test standard or approve a result.
GDMS keeps the working context visible through six connected stages of the laboratory record.
Identify the project, material, sample and requested test.
Record masses, dimensions, loads, readings and observations.
Derive the values required by the supported test workflow.
Generate applicable plots, tables and material classifications.
Check inputs, units, calculations, graphs and exceptions.
Issue consistent output linked to its supporting record.
Open a report to inspect the measurements, calculated values, tables and engineering plots used in different material workflows.
Choose software by how well it preserves the complete laboratory record—not simply whether it can reproduce one calculation or report.
| Evaluation Area | Spreadsheets | Standalone Test Program | GDMS |
|---|---|---|---|
| Test context | Repeated in individual files | Usually limited to one test family | Projects, samples, materials, specimens and tests |
| Calculations | User-maintained formulas | Structured for the supported test | Test-specific calculations across multiple material groups |
| Source measurements | May be separated from final reports | Retained within the standalone database | Connected to calculated values and reports |
| Standardization | Varies by workbook and user | Consistent within the test program | Consistent forms and reports across supported workflows |
| Retrieval | File and folder searches | Search within one test application | Managed project and laboratory records |
| Project integration | Manual export and re-entry | Usually limited | Wider GaeaSynergy context where licensed |
A useful evaluation uses real workflow requirements rather than a generic feature checklist.
GDMS is supported within a broader family of subsurface data, visualization and environmental software.
Software developed for practical geoscience and engineering work since 1994.
GAEA solutions have been used by companies and organizations worldwide.
Customers use GAEA software across diverse regulatory and project settings.
Use these guides for deeper evaluation of laboratory data, reporting, migration and software alternatives.
Understand the role of structured geotechnical testing and project data.
Read the complete guideReview the benefits of connecting measurements, calculations and results.
Read the laboratory guidePlan the preparation, mapping, validation and verification of historical records.
Read the migration guideExplore structured calculation, chart and report workflows.
Read the reporting guideReview the transition from standalone gradation analysis to GDMS.
Read the upgrade guideCompare GDMS, gINT and EQuIS in the context of different organizational needs.
Read the software comparisonThe free geotechnical toolkit provides selected soil classification and material calculations. Use the GDMS demonstration when evaluating the complete managed laboratory workflow.
Confirm your test coverage, inspect real report outputs and compare the demonstration with representative laboratory cases.

GAEA Technologies develops and distributes geoscience and engineering solutions worldwide. Our solutions have been used for over 30 years by companies and organizations around the world.
© 2026 GAEA Technologies. All Rights Reserved.