
A wide variety of geophysical data can be displayed on a well log either as graphs or images. The data is displayed in columns and more than one column can contain geophysical data.
Displaying Geophysical Data as Graphs
An unlimited number of geophysical curves can be displayed in a well log and there is no limit on the number of points each geophysical curve can contain. A column can contain either one or multiple geophysical curves. In addition, the geophysical data can be cross-plotted with the lithology.
To display a geophysical curve in a log, the file containing the geophysical curve data must be imported or pasted into the log column. Any editing of the geophysical data on the log will only affect the imported data and will not affect the original data in the geophysical file.
Importing Geophysical Data
Geophysical data can either be imported into a specific column of a log or just into the log itself.
- If no geophysical data has previously been imported for a column, click on the column to import the data or select Edit then Geophysical Data and then the column name.
- To add geophysical data to a log without specifying the column, select Edit then Geophysical Data and then Import Data.
After selecting one of the above options, you will be asked to specify the name of the file containing the geophysical data. Next, you will need to specify the format for the file.
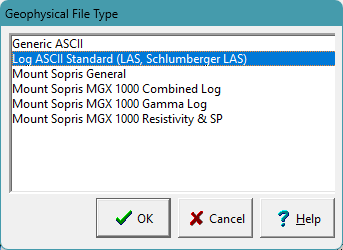
If the format of your log is not shown try to use the Generic ASCII format; otherwise, contact GAEA to see if support for that format can be added. Select the format of the geophysical log file and then press the OK button. Depending upon the format of the geophysical file, you will then be prompted to select which curve (gamma ray, resistivity, SP, etc.) in the file to display. Some geophysical file formats support multiple curves in one file.
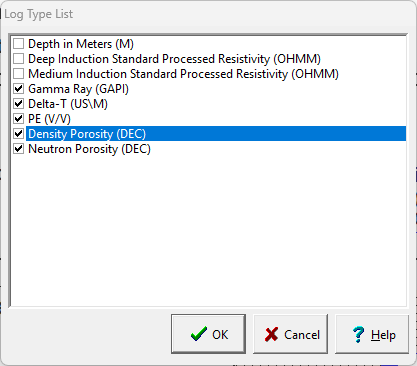
Log Ascii Standard (LAS) Format
The most common format used to store geophysical well log data in a file is LAS. If the file format is LAS the Log Type List form will be displayed. Select the curves to import from the list of available curves in that file. If you are importing the data into a specific column, select only one curve.
Resample Data
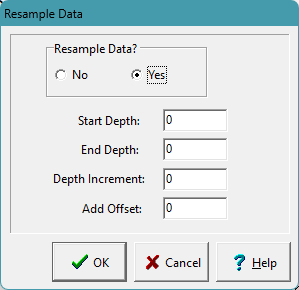
In order to save time and memory when displaying geophysical data, the data can be resampled at the time it is imported into the log. After the curves have been selected, the Resample Data form will be displayed.
If resampling the data the start and end depths, depth increment, and offset need to be specified. Any samples at depths between increments will be ignored. For example, if the Depth Increment is 1 and the file contains samples at depths 1.1, 1.6, and 2.1. The sample at depth 1.6 will be ignored. The Offset is used to adjust for instrument height if necessary.
After resampling has been specified, the data will then be imported into the log,
Editing Geophysical Data
After the geophysical log has been imported, the data can be edited by clicking on the geophysical column on the log or by selecting Edit then Geophysical Data and then the Geophysical Curve Name.
After this the geophysical data form that is displayed will depend on whether it is a single or multiple geophysical data column. If the column contains only one geophysical curve, it the form will have only one tab. If the column contains multiple geophysical curves, the form will have one tab for each curve.
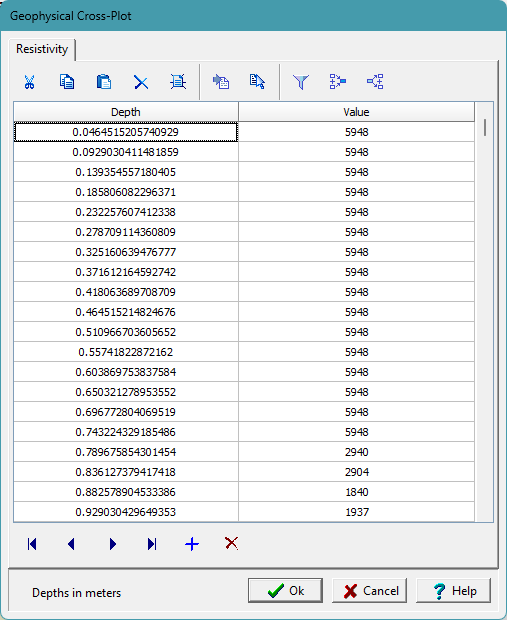
On this form the depths and values can be edited individually or using the buttons on the toolbar at the top. The buttons on the toolbar can be used to:
- Cut, copy, paste, and delete selected data to and from the clipboard.
- Clear the entire dataset.
- Import a new geophysical data.
- Use an existing dataset already in the log.
- Filter the data,
- Splice another dataset into this dataset.
- Merge this dataset with another dataset.
Filtering Data
The geophysical data can be filtered using the filter button on the toolbar.
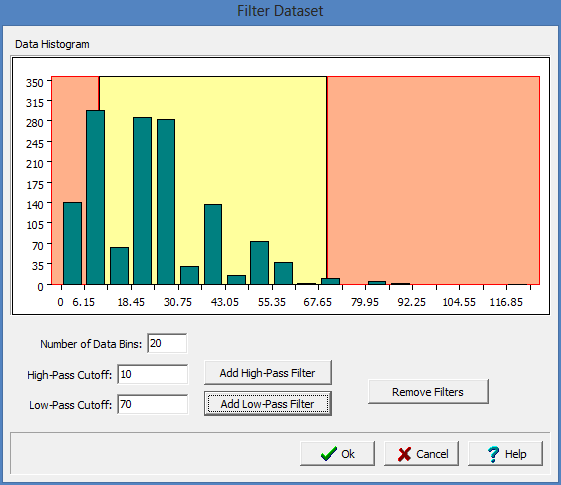
The data can be filtered using a high-pass filter, low-pass filter or both. A histogram will be displayed for the data grouping it into bins. The horizontal axis shows the data values and the vertical axis is the number of occurrences of that value.
A high-pass filter will remove all data values below the cutoff value. It is represented by the region in red on the left side of the histogram.
A low-pass filter will remove all data values above the cutoff value. It is represented by the region in red on the right side of the histogram.
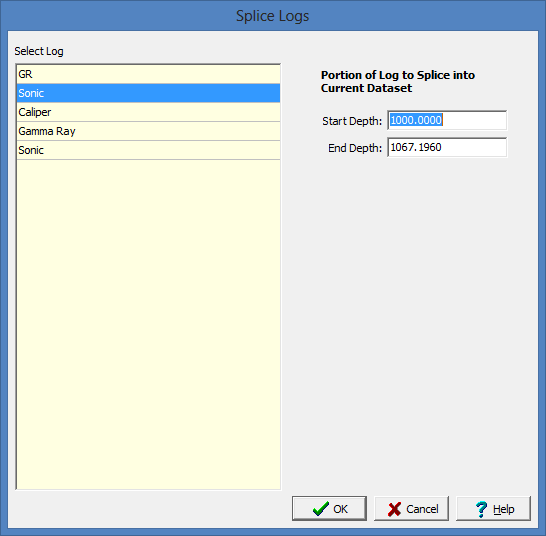
Splicing Data
This function is used to splice a dataset into the current dataset. The spliced dataset will be added from the start and end depths specified. If the current dataset has a value within the spliced depths it will be deleted.
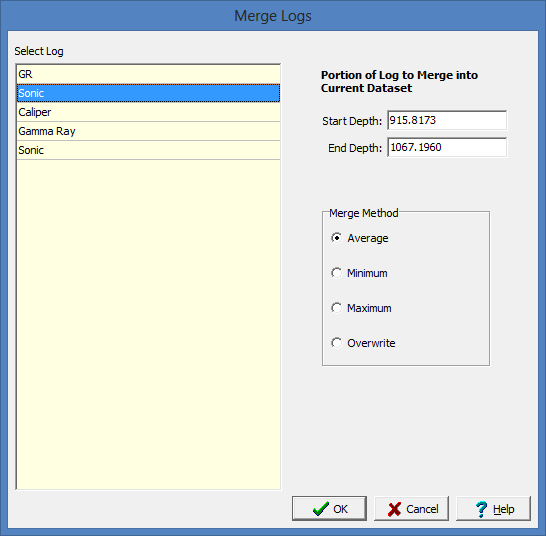
Merging Data
This function is used to merge a dataset with the current dataset. The selected dataset will be merged with the current dataset from the specified start and end depths. The merged data value can be either the average of the two values, minimum of the two values, maximum of the two values, or the selected log value can be overwrite the current log value.
Displaying Geophysical Data as Images
A geophysical log as an TIFF image can be displayed in a column. If no image has been previously specified for the column , you will be asked to select a file when the column is edited. A copy of the selected image file will be placed in the datastore and used for the log. The original image file will not be used.
When the column is edited, the image will be displayed on the Image Viewer form.
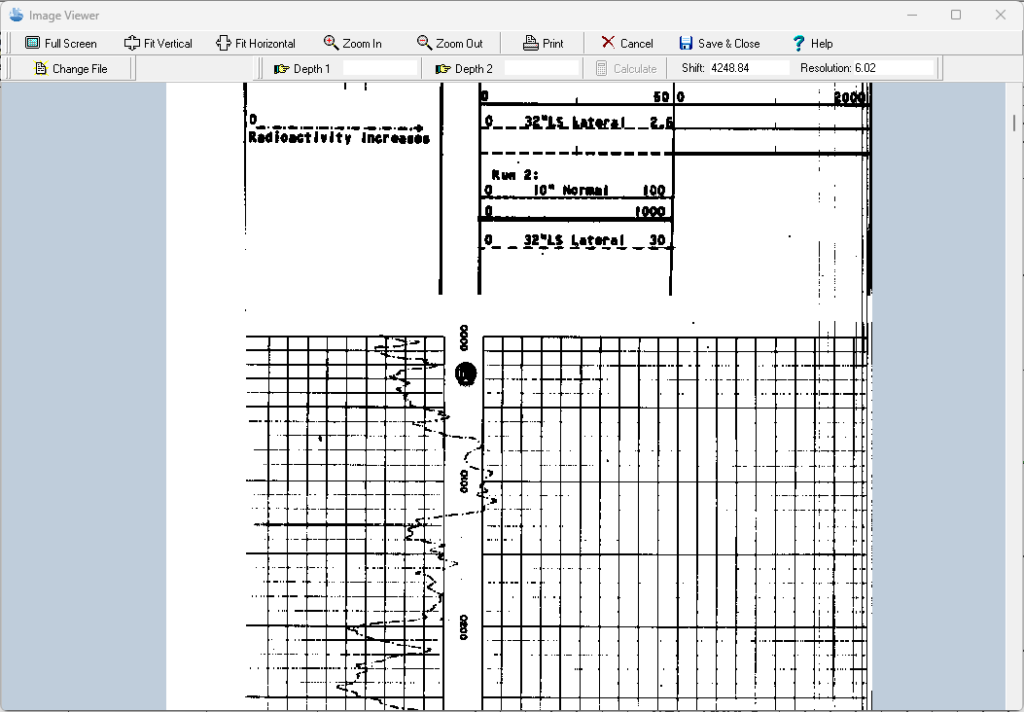
The TIFF image can be zoomed in and out using the buttons at the top of the form or by using the left (zoom-in) and right (zoom-out) mouse buttons. The wheel on the mouse can be used to scroll the image up and down. In addition, the image can be printed or the image file changed.
Depth Registration
The primary purpose of this display is to depth register the image so that depths on the image will correspond with depths on the log. To do this two depths are required to be entered on the image. Enter the first depth by clicking the Depth 1 button. Then scroll to the first depth of the image and click on it, then enter the depth. The second depth is entered the same was as the first. It is recommended that the first depth is near the top of the image and the second near the bottom of the image.
After the two depths have been entered, click on the Calculate button to calculate the Shift and Resolution for the image. The Shift is the number of pixels in the image between the top of the image and zero depth. The Resolution is the number of pixels per depth unit (feet or meters). Using the Shift and Resolution the image can be adjusted so that the depths correspond to the log depths when displayed in the log.
To fine tune the registration, the Shift and Resolution can also be entered manually.
With WinLoG, create borehole and well logs effortlessly, enhance collaboration, and deliver seamless projects.
Related Articles
- Creating a Borehole Log from Field Data Using WinLoG and WinLoG Field Assistant
- Using Templates for Faster Borehole Logging: Standardizing Geotechnical Workflows in WinLoG
- Editing and Structuring Lithology Data: Best Practices for Accurate Borehole Logs and Geoscience Workflows
- WinLoG Advanced Features You’re Not Using (But Should)
- How Do I Create and Manage Lithologic Libraries in WinLoG?
- How Do I Create and Enter Tables in WinLoG Templates and Logs?
- How Do I Upgrade a Single User version to WinLoG Version 6?
- Moving to WinLoG v6: Seamless Data Migration for Your Borehole History
- How to use Lithology Descriptors to Standardize Logs
- How to use Sample Descriptors to Standardize Logs
- How to Quickly Enter Standardized Lithologic Layers in WinLoG
- How to Create a Well Diagram in WinLoG
- How to Import Boring and Well Data from Excel in WinLoG
- How to Import Multiple Boring and Well Locations from Excel to WinLoG
- Why is my WinLoG header data not displaying on the log?
- Why do some of the WinLoG headers in my template not appear when entering boring data?