
Overview
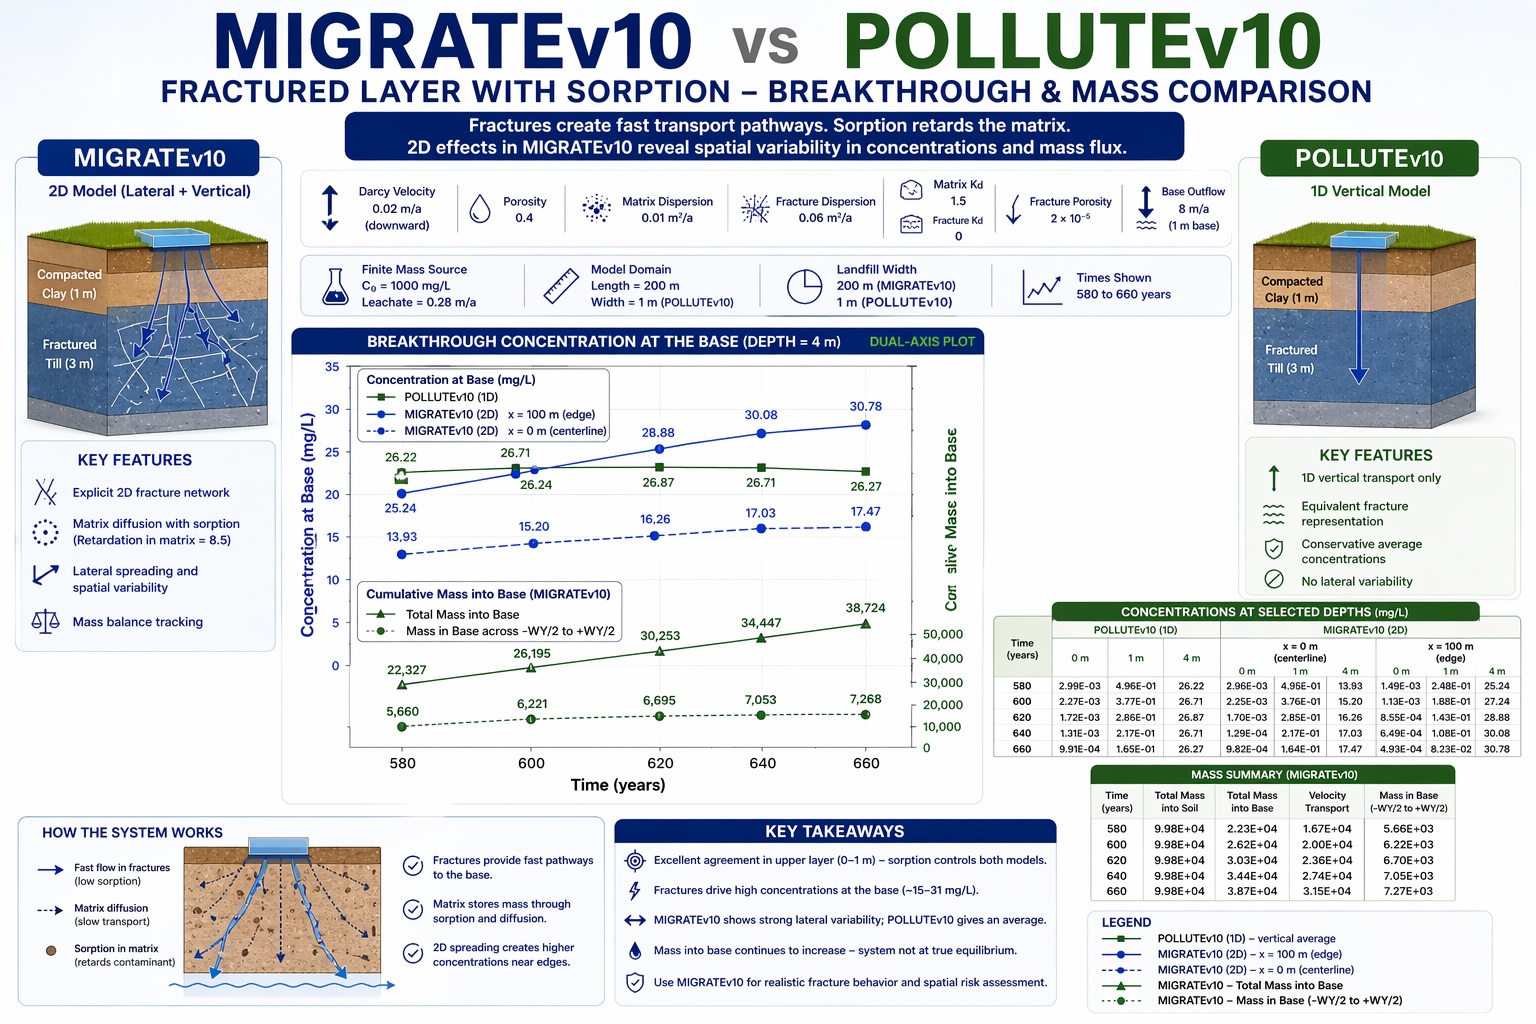
This example compares results from MIGRATEv10 and POLLUTEv10 for a fractured soil layer with sorption.
This is one of the more complex transport scenarios, combining:
- Advection and dispersion
- Fracture flow (fast pathways)
- Matrix diffusion
- Sorption (retardation)
The result is a system where contaminants can move rapidly through fractures while simultaneously being retarded and stored in the soil matrix.
Model Setup
Both models simulate a two-layer system:
Layers
- Compacted clay (1 m)
- Fractured till (3 m)
Key parameters
- Vertical velocity: 0.02 m/a
- Dispersion:
- Matrix: 0.01 m²/a
- Fractures: 0.06 m²/a
- Porosity: 0.4
- Sorption:
- Matrix Kd ≈ 1.5
- Retardation factor ≈ 8.5 (MIGRATE)
- Fractures:
- Very low porosity (2 × 10⁻⁵)
- Multiple fracture sets
Boundary conditions
- Finite mass source (1000 mg/L)
- Advective outflow at base (8 m/a)
Results Comparison
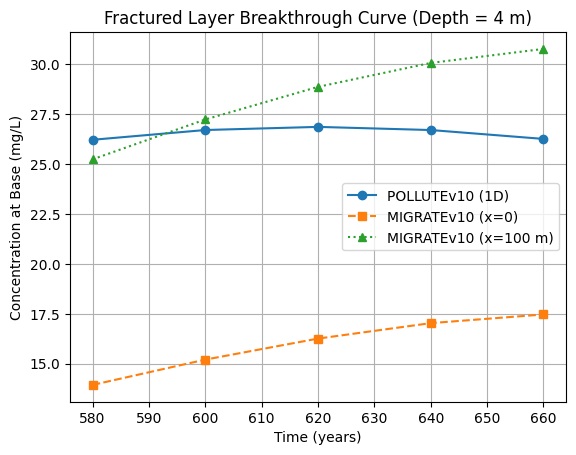
Concentrations at 600 Years
POLLUTEv10 (1D)
| Depth (m) | Concentration (mg/L) |
|---|---|
| 0 | 2.27 × 10⁻³ |
| 1 | 0.377 |
| 4 | 26.7 |
MIGRATEv10 (2D)
| Location | Depth = 4 m (mg/L) |
| x = 0 m | 15.2 |
| x = 100 m | 27.2 |
Key Observations
1. Strong agreement in the upper layers
At shallow depths:
- Concentrations at 0–1 m match very closely
- Example at 600 years:
- ~0.002–0.003 mg/L at surface
- ~0.38 mg/L at 1 m
👉 Both models accurately capture sorption-controlled retardation
2. Fracture-driven transport dominates at depth
At 4 m:
- Concentrations are very high (~25–30 mg/L)
- Despite strong sorption in the matrix
👉 Indicates that:
- Fractures act as fast transport pathways
- Matrix sorption cannot fully prevent breakthrough
3. Centerline vs lateral variability (MIGRATEv10)
At 600 years:
- x = 0 m → ~15 mg/L
- x = 100 m → ~27 mg/L
👉 Large lateral variation due to:
- Finite source width
- 2D plume spreading
- Fracture network geometry
4. POLLUTE vs MIGRATE at the base
- POLLUTEv10: ~26.7 mg/L
- MIGRATEv10:
- Lower at center (~15 mg/L)
- Higher near edges (~27–30 mg/L)
📌 Interpretation:
- POLLUTE represents a 1D average / centerline approximation
- MIGRATE reveals spatial variability and plume structure
5. Role of Sorption
Sorption significantly slows transport:
- Surface concentrations are extremely low (~10⁻³ mg/L)
- Indicates strong retardation
However:
👉 Sorption is less effective in fractures, where:
- Flow velocities are higher
- Interaction with the matrix is limited
6. Mass Transport (MIGRATE insight)
At 600 years:
- Mass into soil ≈ 9.98 × 10⁴
- Mass into base ≈ 2.62 × 10⁴
👉 A substantial fraction of contaminant mass:
- Has migrated through the system
- Despite retardation effects
Key Differences Summary
| Feature | MIGRATEv10 | POLLUTEv10 |
| Dimensionality | 2D (x–z) | 1D (z only) |
| Fracture modeling | Explicit 2D behavior | Equivalent 1D representation |
| Sorption effects | Included | Included |
| Upper layer agreement | Excellent | Benchmark |
| Base concentration | Variable (15–30 mg/L) | ~27 mg/L |
| Lateral variability | Captured | Not captured |
| Mass tracking | Yes | No |
Interpretation
This case highlights a critical concept:
Fractures can bypass sorption-controlled matrix transport.
- POLLUTEv10 provides a useful average estimate
- MIGRATEv10 shows:
- Preferential pathways
- Spatial variability
- Realistic plume behavior
Key Insight
Even with strong sorption:
- Contaminants can still reach the base at significant concentrations
- Fractures dominate long-term transport behavior
Conclusion
This comparison demonstrates that:
- Both models correctly simulate fracture + sorption physics
- Differences arise from how spatial variability is represented
Practical guidance:
- Use POLLUTEv10 for:
- Screening-level analysis
- Conservative average concentrations
- Use MIGRATEv10 for:
- Fractured media analysis
- Plume geometry and variability
- Detailed risk assessment