
Introduction
Lithology data is one of the most critical components of any borehole log. It provides a detailed description of subsurface materials, forming the basis for geotechnical analysis, environmental assessments, hydrogeological modeling, and engineering design.
However, lithology data is often inconsistent, unstructured, and difficult to interpret—especially when collected across multiple projects, teams, or field personnel. Variations in terminology, formatting, and level of detail can lead to confusion, errors, and inefficiencies downstream.
Editing and structuring lithology data is therefore not just a data cleanup task—it is a fundamental step in building reliable, scalable, and analysis-ready geoscience datasets.
In this guide, we explore how to effectively edit, standardize, and structure lithology data to improve the quality of borehole logs and enable advanced workflows.
🧭 Why Lithology Data Structure Matters
Lithology descriptions are used in:
- Borehole logs
- Geological cross-sections
- Subsurface models
- Contaminant transport analysis
- Engineering design reports
When lithology data is poorly structured:
- Interpretation becomes subjective
- Data cannot be easily compared
- Automation becomes impossible
- Errors propagate into reports and models
Key Benefits of Structured Lithology Data
✔ Consistency Across Projects
Standardized descriptions ensure uniformity regardless of who collected the data.
✔ Improved Data Quality
Structured inputs reduce ambiguity and errors.
✔ Faster Processing
Automated workflows rely on consistent data formats.
✔ Better Visualization
Clean data produces clearer borehole logs and cross-sections.
🧱 Understanding Lithology Data Components
Before editing lithology data, it’s important to understand its core components.
🔹 Primary Material Type
- Clay
- Silt
- Sand
- Gravel
- Rock
🔹 Secondary Modifiers
- Sandy clay
- Silty sand
- Gravelly silt
🔹 Descriptive Attributes
Color
- Brown
- Grey
- Reddish
Moisture
- Dry
- Moist
- Saturated
Consistency / Density
- Soft / stiff (cohesive soils)
- Loose / dense (granular soils)
🔹 Additional Observations
- Organic content
- Cementation
- Fracturing (for rock)
✏️ Editing Lithology Data
Raw lithology descriptions often come from field notes and require refinement.
Common Issues in Raw Data
❌ Inconsistent Terminology
- “Silty clay” vs “Clay with silt”
- “Fine sand” vs “Sand (fine)”
❌ Overly Verbose Descriptions
- Long, unstructured text blocks
- Difficult to parse or compare
❌ Missing Key Information
- No moisture condition
- No density/consistency
Step-by-Step Editing Process
1. Normalize Terminology
Convert descriptions into a consistent format.
Example:
Before:
“Brown sandy clay with some gravel and a bit moist”
After:
“Clay, sandy, gravelly, brown, moist”
2. Standardize Order of Descriptors
Use a consistent sequence:
Material → Modifiers → Color → Moisture → Density
3. Remove Redundancy
Avoid repeating the same information.
4. Fill Data Gaps
Where possible, add missing attributes based on field context.
🧩 Structuring Lithology Data
Editing improves readability—but structuring makes data usable.
Structured vs Unstructured Data
❌ Unstructured:
“Brown silty clay with gravel, moist, soft”
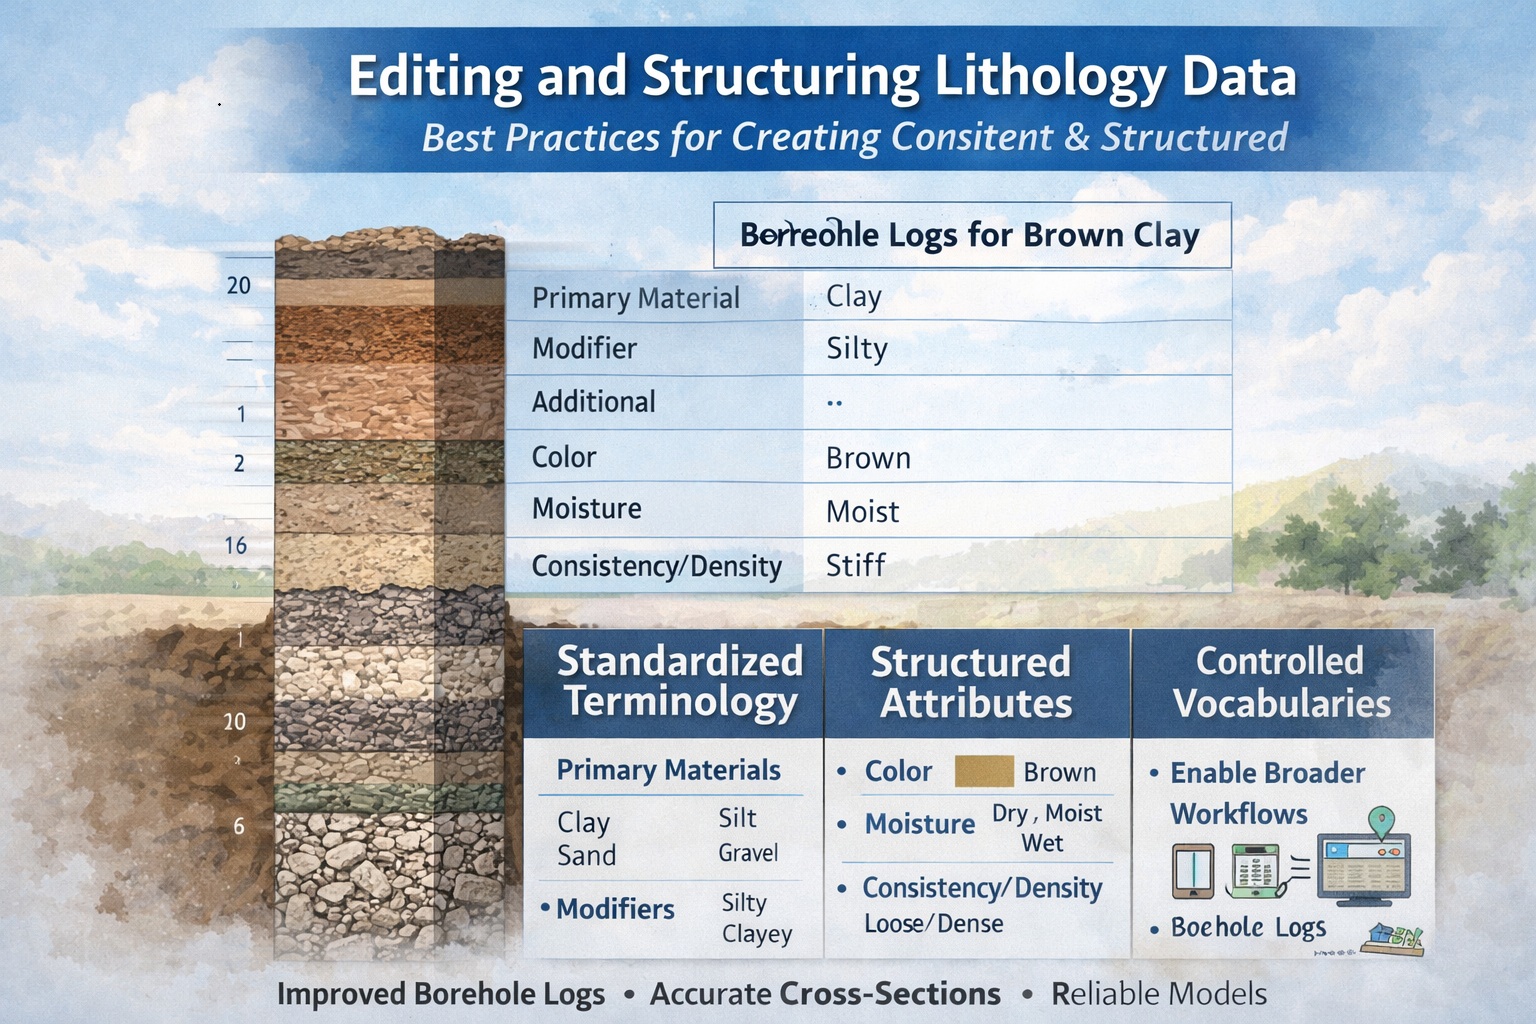
✅ Structured:
| Field | Value |
|---|---|
| Primary Material | Clay |
| Modifier | Silty |
| Additional | Gravelly |
| Color | Brown |
| Moisture | Moist |
| Consistency | Soft |
Benefits of Structured Data
- Enables filtering and querying
- Supports automation
- Improves data integration
- Enhances visualization
🧰 Using Standardized Lithology Descriptors
Standardization is key to scalable workflows.
Controlled Vocabularies
Create predefined lists for:
Materials
- Clay
- Silt
- Sand
- Gravel
Modifiers
- Silty
- Sandy
- Gravelly
Moisture
- Dry
- Moist
- Wet
Density / Consistency
- Loose / dense
- Soft / stiff
Why This Matters
Controlled vocabularies:
- Prevent inconsistencies
- Improve searchability
- Enable automation
📊 Structuring Lithology in Software Workflows
In tools like WinLoG, lithology data is used to generate:
- Graphical columns
- Symbols and patterns
- Subsurface interpretations
Key Structuring Techniques
1. Layer-Based Organization
Each lithology unit must have:
- Top depth
- Bottom depth
- Description
2. Attribute Separation
Store each descriptor in separate fields.
3. Use of Codes
Example:
- CL = Clay
- SM = Silty sand
- GP = Poorly graded gravel
Advantages of Coding Systems
- Faster data entry
- Reduced ambiguity
- Easier analysis
🎨 Visual Representation of Lithology
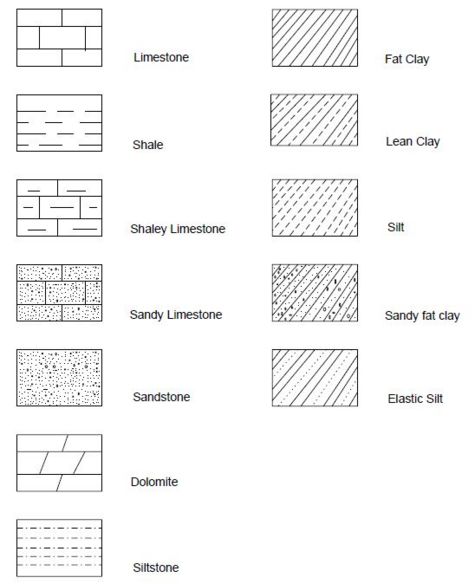
Once structured, lithology data can be visualized effectively.
Common Visualization Elements
- Color coding
- Pattern fills
- Symbols
Why Visualization Depends on Structure
If lithology data is inconsistent:
- Patterns may be incorrect
- Logs become misleading
- Cross-sections lose accuracy
⚠️ Common Mistakes to Avoid
❌ Mixing Free Text and Structured Data
Creates inconsistency
❌ Overcomplicating Descriptions
Too much detail reduces clarity
❌ Ignoring Standards
Leads to unusable datasets
❌ Inconsistent Depth Intervals
Breaks continuity in logs
🚀 Best Practices for Lithology Data Management
✔ Use Standard Templates
Ensure consistency across projects
✔ Train Field Staff
Consistency starts in the field
✔ Validate Data Early
Catch errors before processing
✔ Maintain Data Dictionaries
Define all terms and codes
✔ Integrate with Databases
Enable long-term data management
🔗 Integration with Broader Workflows
Structured lithology data feeds into:
- Borehole log generation
- Cross-section modeling
- GIS systems
- Contaminant transport models
Example Workflow
- Field data collection
- Lithology editing
- Data structuring
- Visualization
- Modeling
- Reporting
🌍 Industry Applications
Geotechnical Engineering
- Soil classification
- Foundation design
Environmental Consulting
- Contaminant transport analysis
- Site characterization
Hydrogeology
- Aquifer identification
- Groundwater modeling
Mining & Exploration
- Stratigraphic interpretation
- Resource estimation
🏁 Conclusion
Editing and structuring lithology data is a foundational step in any geoscience workflow. Without consistent and well-organized data, even the most advanced tools and models will produce unreliable results.
By standardizing terminology, structuring attributes, and implementing controlled vocabularies, you can transform raw field descriptions into high-quality datasets that support accurate analysis, clear visualization, and efficient reporting.
As geoscience workflows continue to evolve toward automation and data integration, structured lithology data is no longer optional—it is essential.
Related Articles
- Creating a Borehole Log from Field Data Using WinLoG and WinLoG Field Assistant
- Using Templates for Faster Borehole Logging: Standardizing Geotechnical Workflows in WinLoG
- WinLoG Advanced Features You’re Not Using (But Should)
- How Do I Use Calculated Graph Columns in WinLoG?
- How Do I Create and Manage Lithologic Libraries in WinLoG?
- How Do I Create and Enter Tables in WinLoG Templates and Logs?
- How Do I Upgrade a Single User version to WinLoG Version 6?
- Moving to WinLoG v6: Seamless Data Migration for Your Borehole History
- How to use Lithology Descriptors to Standardize Logs
- How to use Sample Descriptors to Standardize Logs
- How to add Geophysical Data to a Well Log in WinLoG
- How to Quickly Enter Standardized Lithologic Layers in WinLoG
- How to Create a Well Diagram in WinLoG
- How to Import Boring and Well Data from Excel in WinLoG
- How to Import Multiple Boring and Well Locations from Excel to WinLoG
- Why is my WinLoG header data not displaying on the log?
- Why do some of the WinLoG headers in my template not appear when entering boring data?