

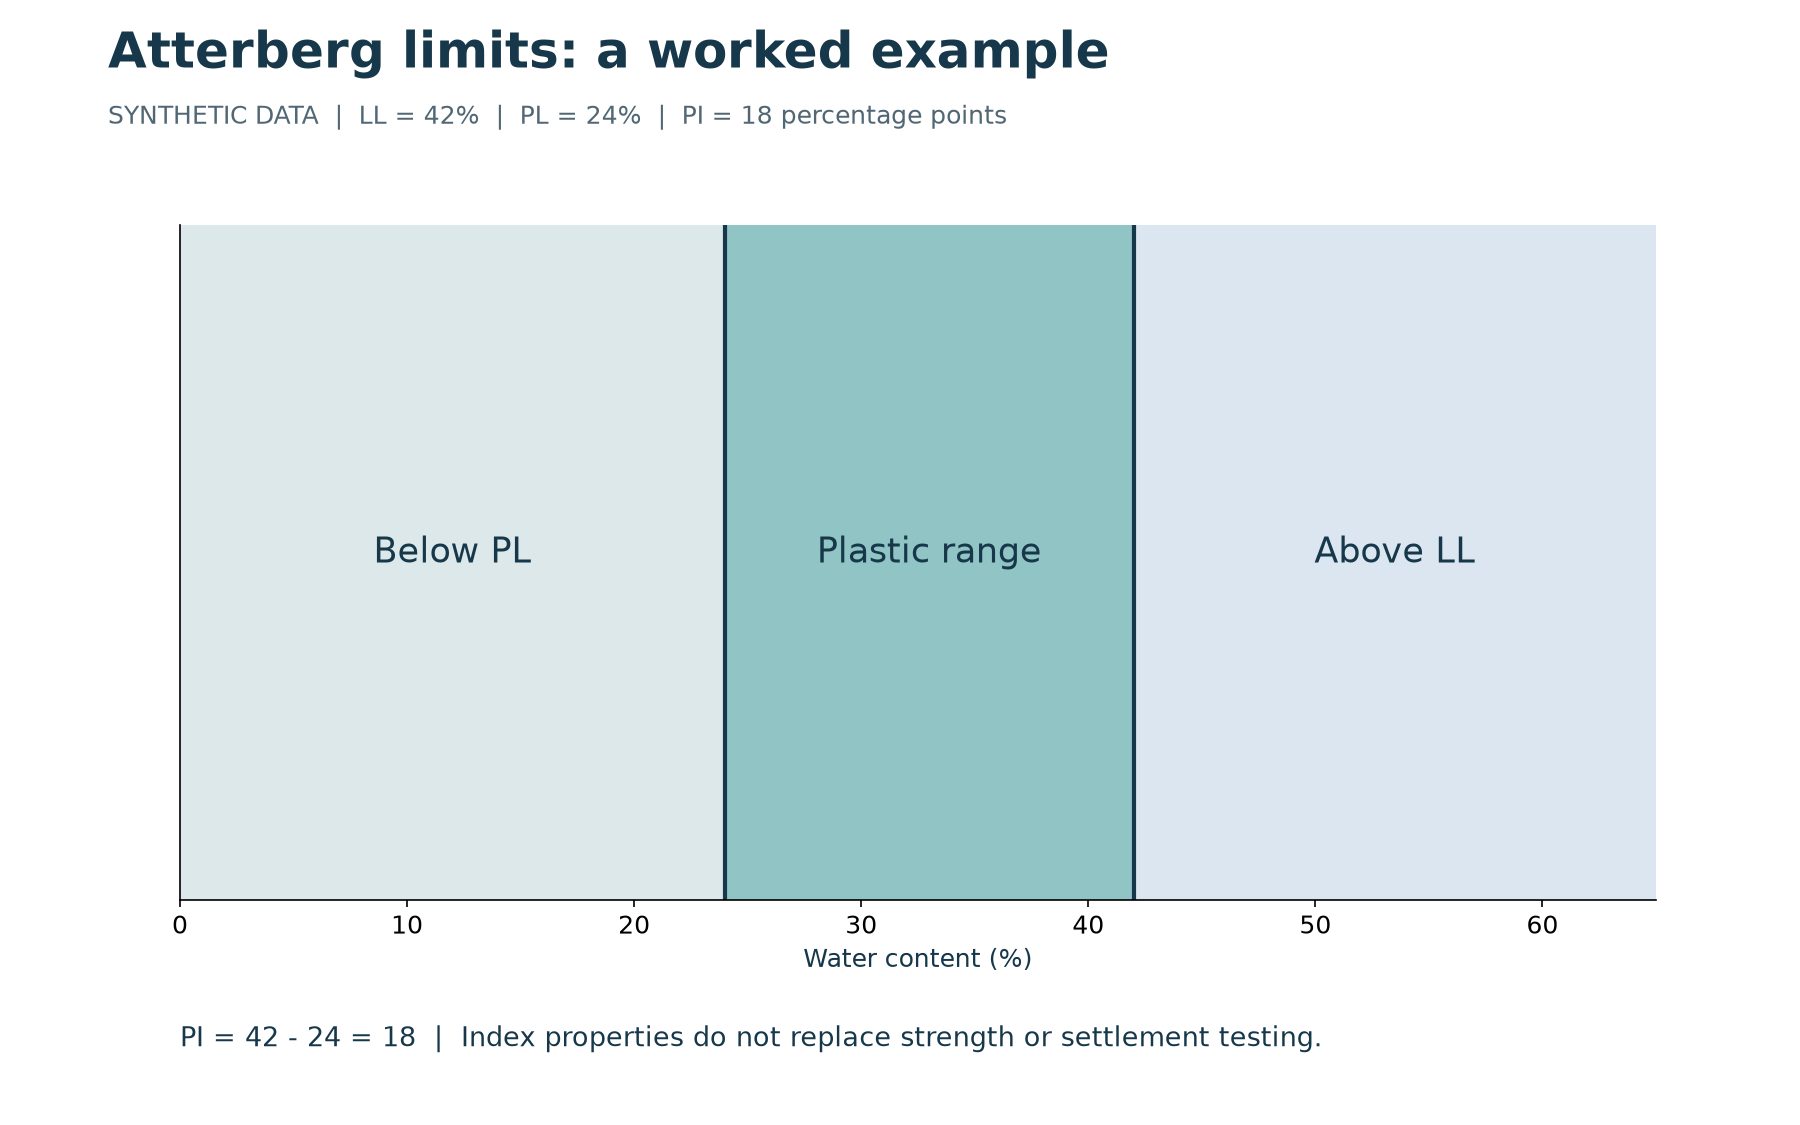
Atterberg limits describe how the consistency of a fine-grained soil changes with water content under defined test conditions. In routine geotechnical reporting, the values most often discussed are liquid limit, plastic limit and plasticity index. They help classify material and compare specimens, but they are index properties rather than direct measurements of every engineering behaviour.
The essential calculation is straightforward: plasticity index equals liquid limit minus plastic limit. Interpreting that number responsibly requires more context. The specimen, preparation, test method and reporting conventions all matter. This guide separates the arithmetic from the laboratory procedure and provides synthetic examples that can be checked by hand.
Download the worked reference
The geotechnical worked-examples PDF contains the example used here alongside USCS, compaction and sieve-analysis references. All values are invented for education. They do not constitute a completed standards-compliant test or a material acceptance recommendation. Use the applicable laboratory procedure for real testing.
What is liquid limit?
Liquid limit, usually abbreviated LL, is a water-content index associated with a defined transition in soil consistency under the selected test procedure. It is commonly reported as a percentage of dry soil mass. The procedure establishes how the specimen is prepared, tested and evaluated; it is not determined simply by looking at whether soil appears wet.
Different testing frameworks and apparatus must be identified correctly. When comparing historical results, check the method and edition rather than assuming every number labelled LL was obtained in exactly the same way. ASTM’s soil-testing reference identifies D4318 as the method covering liquid limit, plastic limit and plasticity index. D2487 addresses classification; the two designations describe different tasks.
What is plastic limit?
Plastic limit, or PL, is another defined water-content index used to describe the lower boundary of the plastic consistency range. It depends on the specified preparation and test process, including the criterion used to identify the endpoint. It should not be estimated from a casual field observation and then presented as a laboratory measurement.
A valid determination needs the required repeat measurements and checks. Experience and consistency matter because specimen handling affects the outcome. Record whether the result is measured, not determined or reported as nonplastic according to the governing method. Those states are different and should remain distinguishable in a database or report.
Calculate plasticity index
For a synthetic specimen with LL = 42 and PL = 24, PI = 42 – 24 = 18. Because both inputs are water-content percentages, the subtraction represents a difference of eighteen percentage points. Laboratory reports commonly display PI as the numerical index 18. Preserve the reporting convention used by the governing method and your approved template.
The calculation describes the width of the plastic range represented by these indices. It is not the specimen’s current water content. If the natural water content is separately measured, keep that observation in its own field. Confusing a measured water content with a limit can produce a plausible-looking number that has the wrong meaning.
Check water-content arithmetic first
Water content is calculated from the mass of water divided by the mass of dry soil, multiplied by 100. Suppose a container weighs 10.0 g, the container plus wet specimen weighs 38.4 g and the container plus dry specimen weighs 30.0 g. The wet soil mass is 28.4 g, the dry soil mass is 20.0 g and the water mass is 8.4 g. Water content is therefore 8.4 / 20.0 x 100 = 42 percent.
This is an arithmetic example only. A single water-content determination does not automatically establish a liquid limit. It must be associated with the correct test observations and evaluated under the prescribed procedure. The example is useful because it exposes a frequent spreadsheet mistake: dividing by the container-plus-dry mass instead of the dry soil mass alone.
What the plasticity chart adds
Liquid limit and plasticity index can be considered together on a plasticity chart. Their position supports the classification of appropriate fine-grained soils and the fine fraction of coarse-grained soils under the applicable system. Classification also depends on other information, including particle-size distribution and the treatment of organic or borderline materials.
For the synthetic LL 42 and PI 18 example, the A-line value at LL 42 is 0.73 x 22 = 16.06. The example plots above that line. This is one part of the classification process, not an instruction to assign the same symbol to every specimen with similar appearance. Consult the FHWA classification overview and the project-specified method for the complete context.
What Atterberg limits do not tell you
Atterberg limits can contribute to understanding and comparing material behaviour, but they do not directly supply a universal shear strength, settlement prediction or hydraulic conductivity. Empirical correlations have defined conditions and limitations. A correlation developed for one material or purpose should not be transferred to another setting without technical justification.
The FHWA discussion of soil properties treats these limits as empirical indices. In practice, a reviewer should ask what decision the result is intended to support. A classification exercise and an engineering design assessment may require different additional evidence. Keep the index test in its proper role within the investigation.
Handle nonplastic and missing results explicitly
Nonplastic does not mean missing, and missing does not mean zero. If the material is reported as nonplastic under the method, use the appropriate designation and explanation. If a measurement was not obtained, preserve that status. A software field that accepts only a number may need an associated qualifier or note rather than an invented numerical substitute.
An unexpected relationship such as PL greater than LL should trigger review. Check identifiers, masses, calculations, units, preparation and transcription. Do not simply change the negative difference to zero to make a report look normal. Resolve the underlying problem or document why a valid result cannot be reported.
Build a useful laboratory report
Include project and specimen identity, source depth or interval where relevant, test method and edition, preparation information needed for interpretation, results and any qualifications. Preserve the original measurements and calculation record separately from the issued summary. Name the reviewer and retain the version of the report that was issued.
A well-organized workflow allows someone to trace PI back to LL and PL, and those values back to the observations and mass records. If a mass or sample identifier changes, the affected calculations and outputs should be reviewed together. That relationship is more valuable than a polished chart whose provenance cannot be reconstructed.
Review the workflow in GDMS
For the software steps, use GAEA’s Atterberg-limits tutorial. Confirm that the supported procedure, calculation settings and report template match the laboratory’s requirements. The tutorial’s legacy title references D2487; distinguish classification requirements from the D4318 limit-testing method when documenting your actual test.
A useful demonstration follows a specimen from original measurements through calculations to a reviewed report, including an amended input. Ask the reviewer to compare the output with an independently checked example. That approach helps establish a repeatable laboratory workflow while keeping technical responsibility with the people who perform and approve the test.