

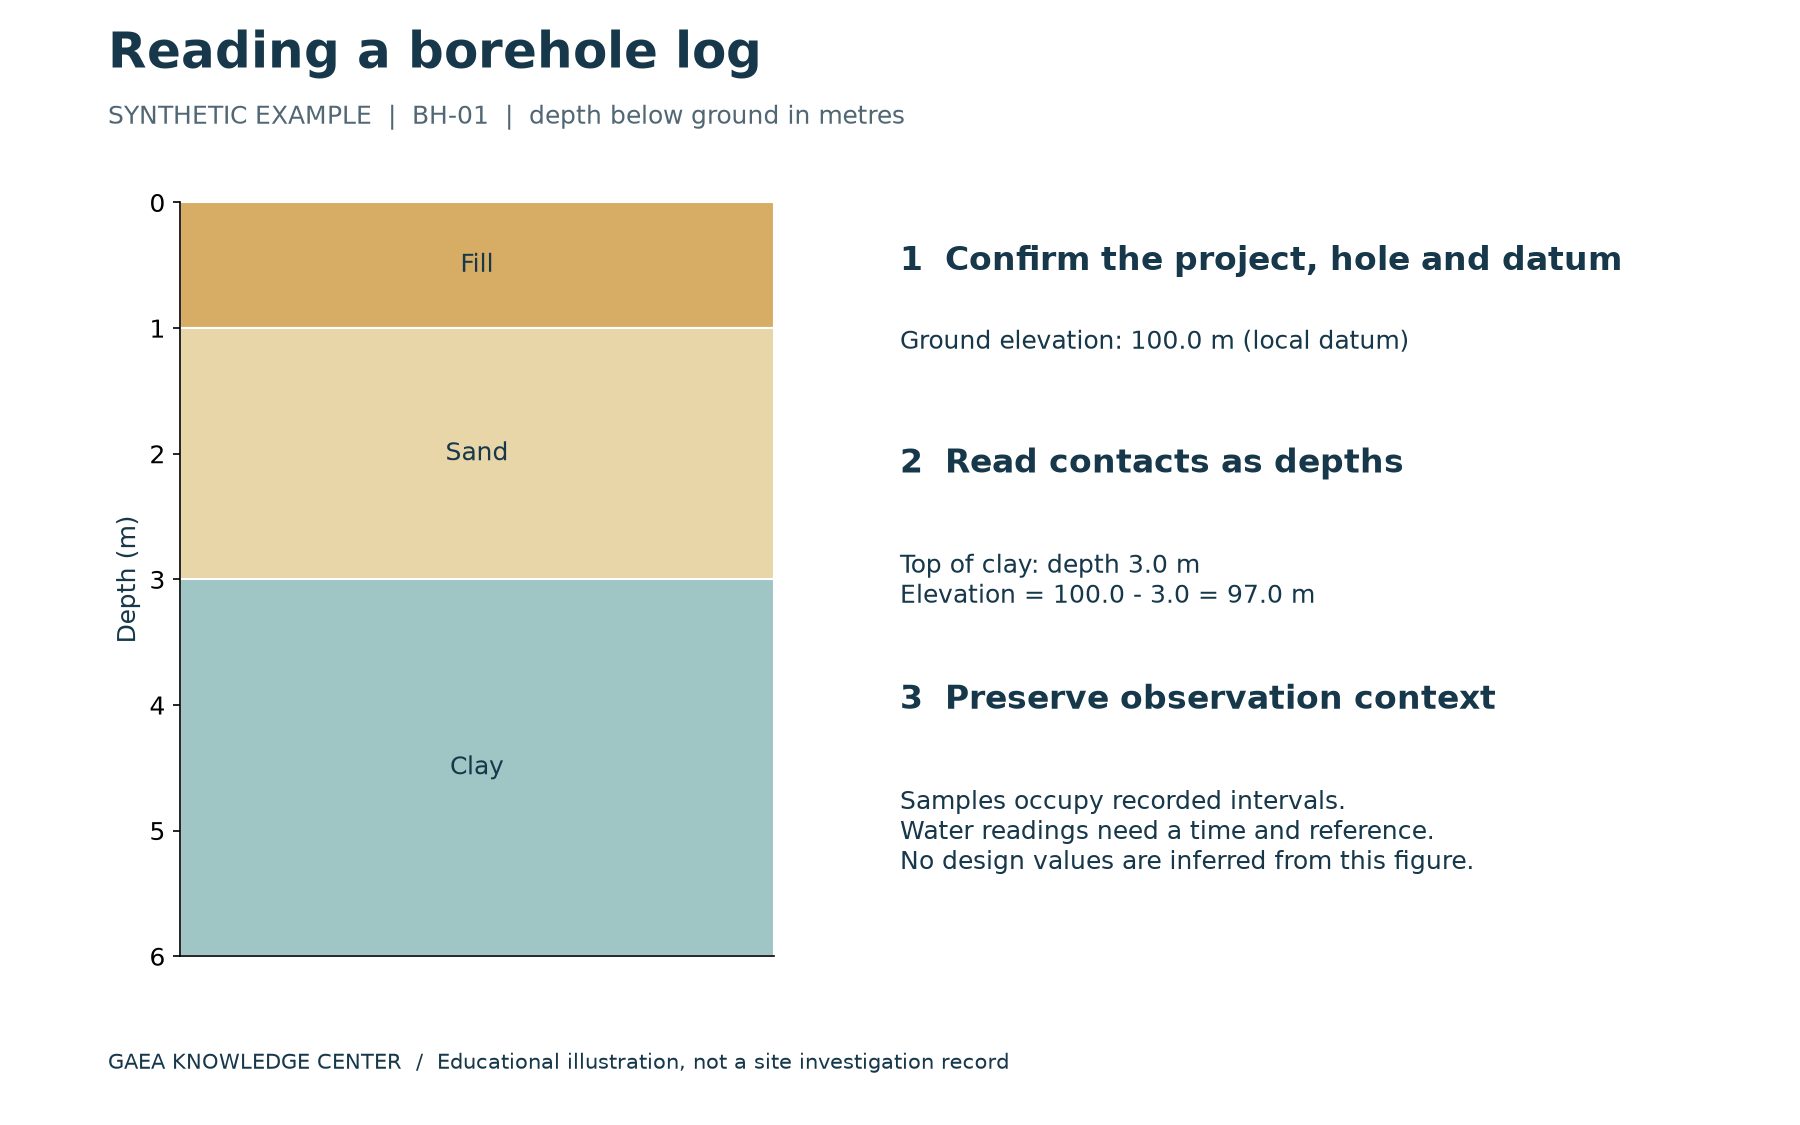
A borehole log is a depth-based record of an investigation at one location. It brings together the materials encountered, samples collected, measurements and observations needed to understand that hole. To read it reliably, start with the header and reference information, then work down the depth scale. A convincing colour pattern is not enough: the units, sampling context and limits of the investigation determine what the record can support.
This guide uses a deliberately simple synthetic example. BH-01 has a ground elevation of 100.0 m on a local datum and ends at 6.0 m below ground. It records fill from 0.0 to 1.0 m, sand from 1.0 to 3.0 m and clay from 3.0 to 6.0 m. These invented values illustrate how to read the document; they are not measurements from a real site or a basis for design.
Download the example and field sheet
Download the borehole field sheet and completed example (PDF). The first page is a blank observation sheet; the second explains BH-01. A generic CSV field sheet is also included in the learning examples pack. Adapt the fields to an approved project procedure before collecting real data. The downloads are educational resources, not native WinLoG templates.
Start with identity and location
Confirm the project name, project number, borehole identifier and revision. A similar hole name in a neighbouring project is not the same record. Next check coordinates, the coordinate reference system and the stated ground elevation. An elevation without a datum can be misleading when compared with a survey, another investigation or a design drawing. Identify whether the position was surveyed, estimated or taken from another source.
Read the drilling dates, method and logger information where provided. A log is the record of a particular investigation, not a timeless description of a site. Ground conditions, fill placement and water observations may differ between visits. If the header omits something essential to your intended use, seek the original field records or ask the responsible professional rather than silently filling the gap.
Distinguish depth from elevation
Depth is commonly measured downward from ground level, but the reference must be stated. Elevation is a height relative to a datum. For a vertical hole with depth measured below ground, subtract depth from the ground elevation. In BH-01, the top of clay is 3.0 m below ground, so its elevation is 100.0 minus 3.0, or 97.0 m on the local datum.
The distinction becomes important when neighbouring holes start at different ground levels. A contact at 3.0 m depth in one hole need not lie at the same elevation as a contact at 3.0 m in another. Also, the simple subtraction used here assumes a vertical hole. Inclined or deviated drilling requires appropriate geometry and survey information before along-hole distances can be converted to vertical positions.
Read the material column and legend together
Follow each interval from its upper boundary to its lower boundary. Look at the written description as well as the graphic pattern. Descriptions can include material type, colour, moisture condition, grading, structure and other observations, depending on the investigation method. The legend explains symbols and abbreviations used in that particular log or report. Similar-looking patterns in different organizations’ templates may have different meanings.
A contact shown as a neat horizontal line can represent an interpreted transition, especially where sampling is intermittent. Check whether the record distinguishes an observed boundary from an inferred one. A short description such as clay does not establish a design strength, compressibility or permeability. The appropriate tests and professional interpretation must support those decisions. Preserve uncertainty instead of converting a tidy graphic into an unjustified claim of precision.
Locate samples independently of material boundaries
A sample interval and a geological interval are different records. In the download, sample S-01 occupies 1.5 to 2.0 m, within the sand interval. That does not mean sand occurs only where the sample was collected. It also does not establish that the entire sand layer was continuously recovered. Check sample type, depth, identifier and any recovery information supplied by the project.
Use the sample identifier to locate associated laboratory results. A result from a neighbouring sample should not be assigned to the whole interval merely because the descriptions look alike. If recovery was incomplete or the sample was disturbed, retain that context. Where a laboratory report uses a different identifier, look for an explicit mapping back to the field sample and borehole.
Understand measurements before comparing numbers
Test columns may show values recorded at particular depths or over particular intervals. Confirm the test type, units and reporting convention. A plotted number could be an original observation, a calculated result or a corrected value. Those categories should not be treated as interchangeable. For example, a raw field measurement and a value adjusted for a specified analytical purpose may require different interpretation.
Review the legend and report methodology before using abbreviations or comparing results across projects. If a test was not completed, a blank, a refusal note or a partial measurement should retain its actual meaning. Do not replace missing results with zero simply to make a plot continuous. The reason a measurement is absent can be more important than the appearance of the graph.
Treat groundwater readings as dated observations
BH-01 includes an observation of water at 2.2 m below ground at 10:30 during drilling. The example deliberately does not call this an equilibrium groundwater level. Drilling conditions, elapsed time, borehole construction and the reference point can affect what a reading represents. Check those details before comparing a field observation with a later monitoring-well measurement.
A symbol beside the depth scale is only the beginning of the record. Look for the date, time, measurement reference and any notes about drilling fluids or the condition of the hole. Several observations may legitimately differ. Preserve the individual measurements and their context rather than combining them into one apparently definitive water line.
Read the end of the hole and the report limitations
An end-of-hole note tells you where the investigation stopped, not necessarily where a geological unit ended. In BH-01, clay is recorded to 6.0 m and the hole terminates there. The log does not establish the base of that clay. Similarly, refusal should be interpreted in the context of the drilling method and evidence; it is not automatically proof of a particular rock surface.
Read the report’s limitations and intended purpose before using an old log for a new project. The hole describes conditions at its investigated location. Continuity between holes is an interpretation that may need additional evidence. For an illustration of that next step, see the cross-section worked example.
A short review sequence
Before relying on a log, confirm its identity and revision, units and datum, depth intervals, sample links, measurement conventions and water-observation context. Then compare the plotted output with the underlying records and investigate missing information. This sequence is useful whether the log originated on paper or in dedicated software.
WinLoG provides tools for structured records, configurable log presentation and supported validation workflows. The software helps organize and review information; the reader still needs to understand what the observations mean. Use the template guide to prepare consistent records, and bring a representative log to a GAEA demonstration if you want to evaluate the full workflow.