

To open a LAS well log file, first confirm that it is a Log ASCII Standard file containing well-log information. Then use a compatible well-log viewer, inspect the header and verify the depth and curve information before interpreting the plot. GAEA provides a free LAS utilities application for viewing and summarizing LAS files through its data-solutions page.
The file extension matters less than the content. LAS is also used for a different LiDAR point-cloud format. A tool intended for one should not be assumed to support the other. This guide concerns text-based well-log LAS files and includes a small synthetic LAS 2.0 example for learning.
Get the viewer and sample
Use the official GAEA data-solutions page to find the current free LAS utilities download. Check the current application requirements and supported formats there or with GAEA. This guide does not promise that every LAS variation or every feature of other log formats is supported by every version of the utility.
Download the learning examples pack and extract synthetic-well-log.las. The file contains invented gamma-ray values for a fictional well, not customer data. It is provided to demonstrate file structure and missing-value handling. It should never be used as measured subsurface evidence.
Identify a well-log LAS file
A typical LAS 2.0 text file contains sections introduced by a tilde, including version, well, curve and ASCII data information. Open a copy in a plain-text editor if you need to inspect it before using a viewer. Preserve the original file. If the content is binary or belongs to a point-cloud workflow, stop and identify the correct format rather than renaming it to make it appear compatible.
The Canadian Well Logging Society LAS 2.0 specification is the authoritative format reference used for the teaching file. LAS versions and extensions can differ. A header that says LAS does not remove the need to check the declared version and the receiving application’s support.
Inspect the sample header
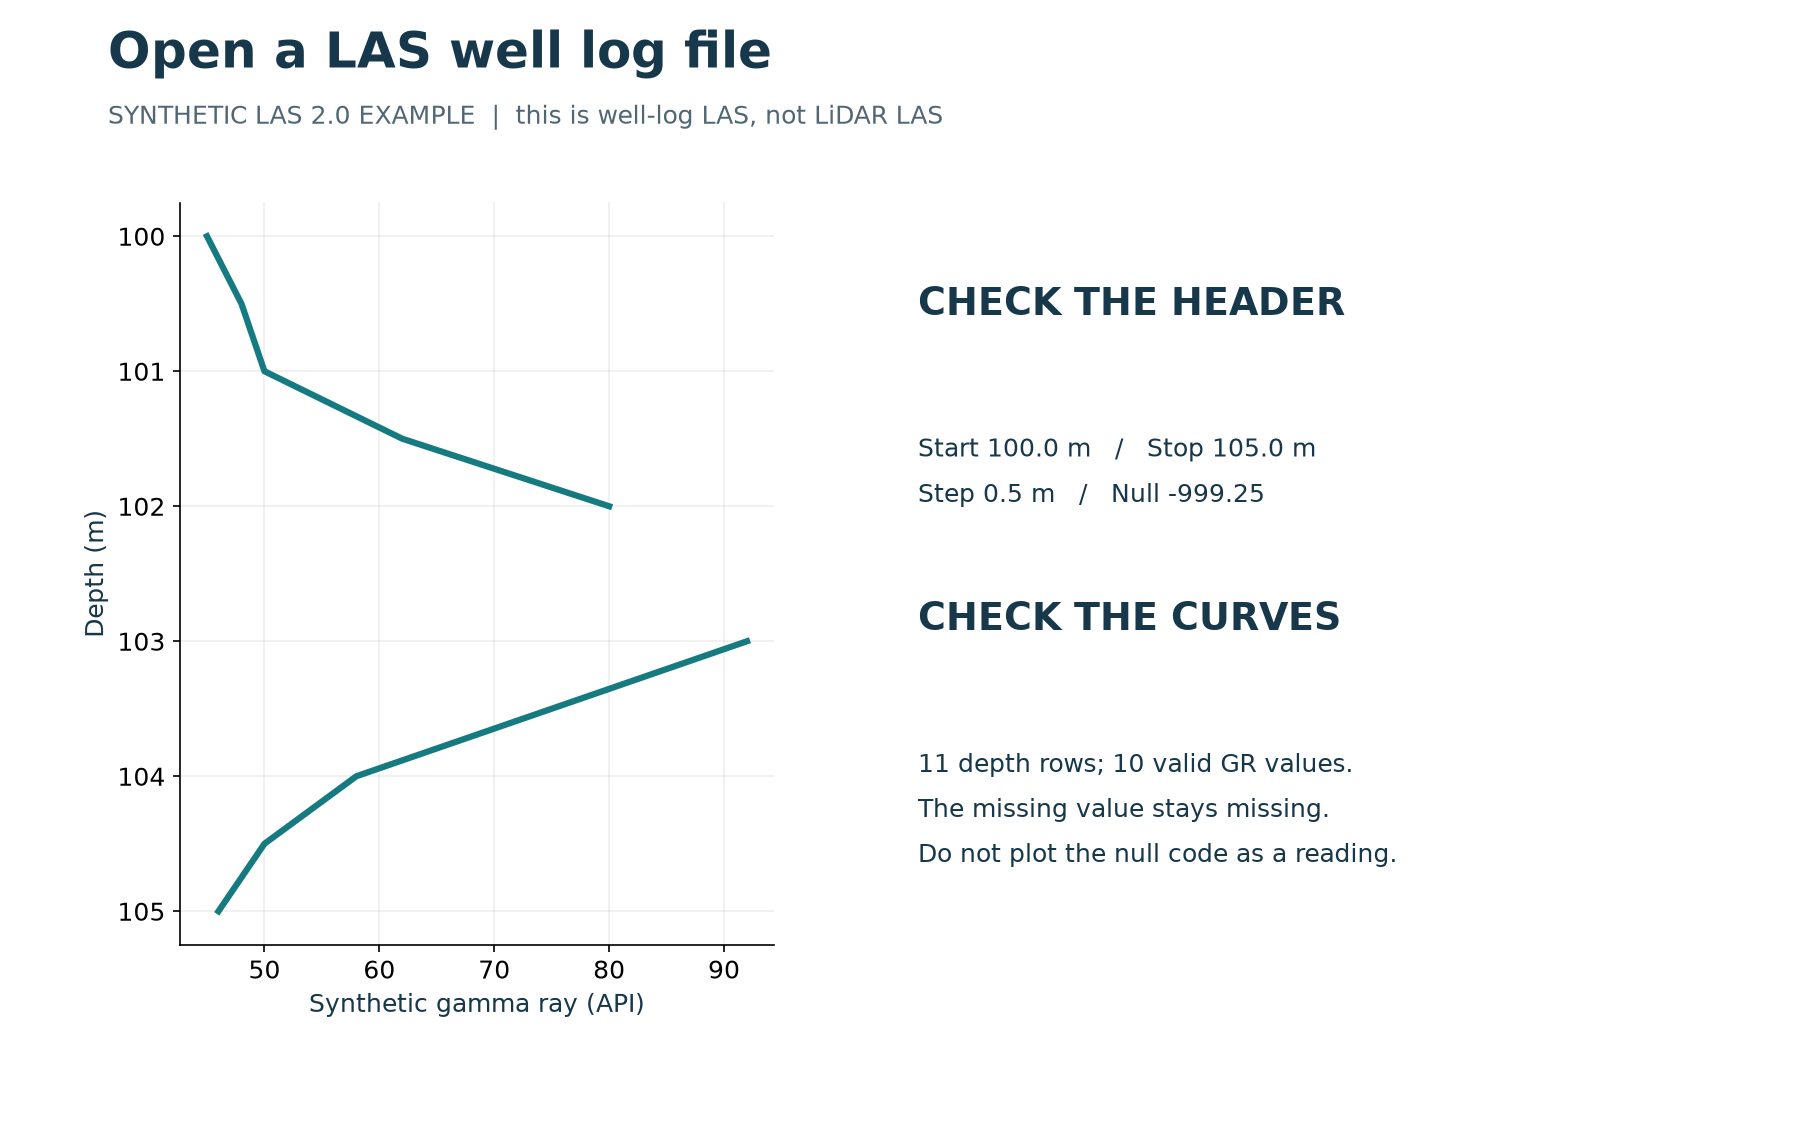
The supplied file declares version 2.0 and WRAP NO, with one data row per depth step. Its start depth is 100.0 m, stop depth 105.0 m and step 0.5 m. It declares -999.25 as the null value. The first curve is depth in metres, followed by a synthetic gamma-ray curve whose unit is API.
Compare these declarations with the data rows. There are eleven depth rows when both endpoints are included: 100.0, 100.5 and so on through 105.0 m. One gamma-ray entry uses the null code, leaving ten valid readings. This small example gives you specific checks to perform rather than asking you to judge whether the plotted curve simply looks plausible.
Open the file in the application
Download and install the current utility through GAEA’s official instructions, then use its file-opening workflow to select the extracted .las file. Exact controls may vary by application version. If the file does not open, verify that you selected the extracted LAS file rather than the ZIP archive, that the extension is correct and that the file was not altered by another application.
Begin with the simple sample before trying a large operational file. That separates basic application setup from issues specific to a real dataset. Keep any diagnostic message and a copy of the original file if you need support. Do not upload confidential well data to an unrelated conversion website merely because it advertises LAS support.
Verify depth and units before reading the curve
Check the plotted depth range and direction. A viewer may display increasing depth downward, as expected in many well-log presentations. Confirm the reference and units before comparing it with another log. Metres and feet are not interchangeable, and matching numeric endpoints do not establish that two files use the same reference.
Review each curve mnemonic, unit and description together. Abbreviations may vary between providers, tools and projects. A familiar mnemonic is a useful clue, not proof that two curves represent identical measurements or processing. Record any interpretation of ambiguous labels and seek source documentation where the distinction matters.
Keep nulls separate from real measurements
The sample’s -999.25 value represents missing information. It should not be plotted or summarized as a physical gamma-ray measurement. If it appears as a large negative spike, inspect the application’s handling of the declared null code. The expected result contains a missing point or gap, not a claim that the instrument measured that negative value.
Do not replace a missing value with zero simply to create a continuous curve. Interpolation or other processing, when justified, should be a documented transformation with a retained original. A smooth line can be visually persuasive while hiding an important gap. The same principle applies when computing minimums, averages or other summaries.
Troubleshoot a file that opens incorrectly
Check whether the number and order of columns agree with the curve definitions. Review the depth sequence, wrap setting and decimal formatting. Confirm that the declared start and stop values agree with the first and last data rows. Unusual spacing, malformed headers or unsupported variations may require format review rather than a change to geological interpretation.
Make corrections only in a working copy, document what changed and compare the result with the source. Avoid broad search-and-replace operations that might alter legitimate values along with an intended header fix. When a file originates from a service provider, obtaining a corrected export can be preferable to repairing an uncertain structure locally.
Compare files without erasing their context
Before comparing curves from two files, establish the well identity, depth references, units, acquisition context and processing history. Similar shapes do not prove that the files represent the same run. Different sample intervals and missing sections can affect both visual comparison and numerical summaries. Retain the original filenames and provenance information.
A viewer is a useful inspection tool, but a successful display is not a complete validation of the dataset. Important metadata may be absent even when the curves render cleanly. If the data will support a migration, interpretation or delivery, define the required checks and acceptance criteria separately.
Use the inspection to improve a digitization handover
When receiving digitized well logs, compare selected output curves with the source image and review depth calibration, units, missing segments and deliverable requirements. Preserve the source image alongside the structured file where the project requires it. The goal is a usable record with traceable meaning, not simply a file carrying a familiar extension.
GAEA’s historical well-log digitization guide provides further context. For a service discussion, bring representative source material and explain the desired output and checks. The synthetic sample here is a first exercise in asking the right questions of a LAS file.