
Introduction
Understanding subsurface conditions is one of the most critical aspects of geotechnical engineering, environmental site assessment, and hydrogeological analysis. While borehole logs provide detailed vertical information, they are inherently limited in their ability to communicate spatial relationships across a site.
This is where fence diagrams become essential.
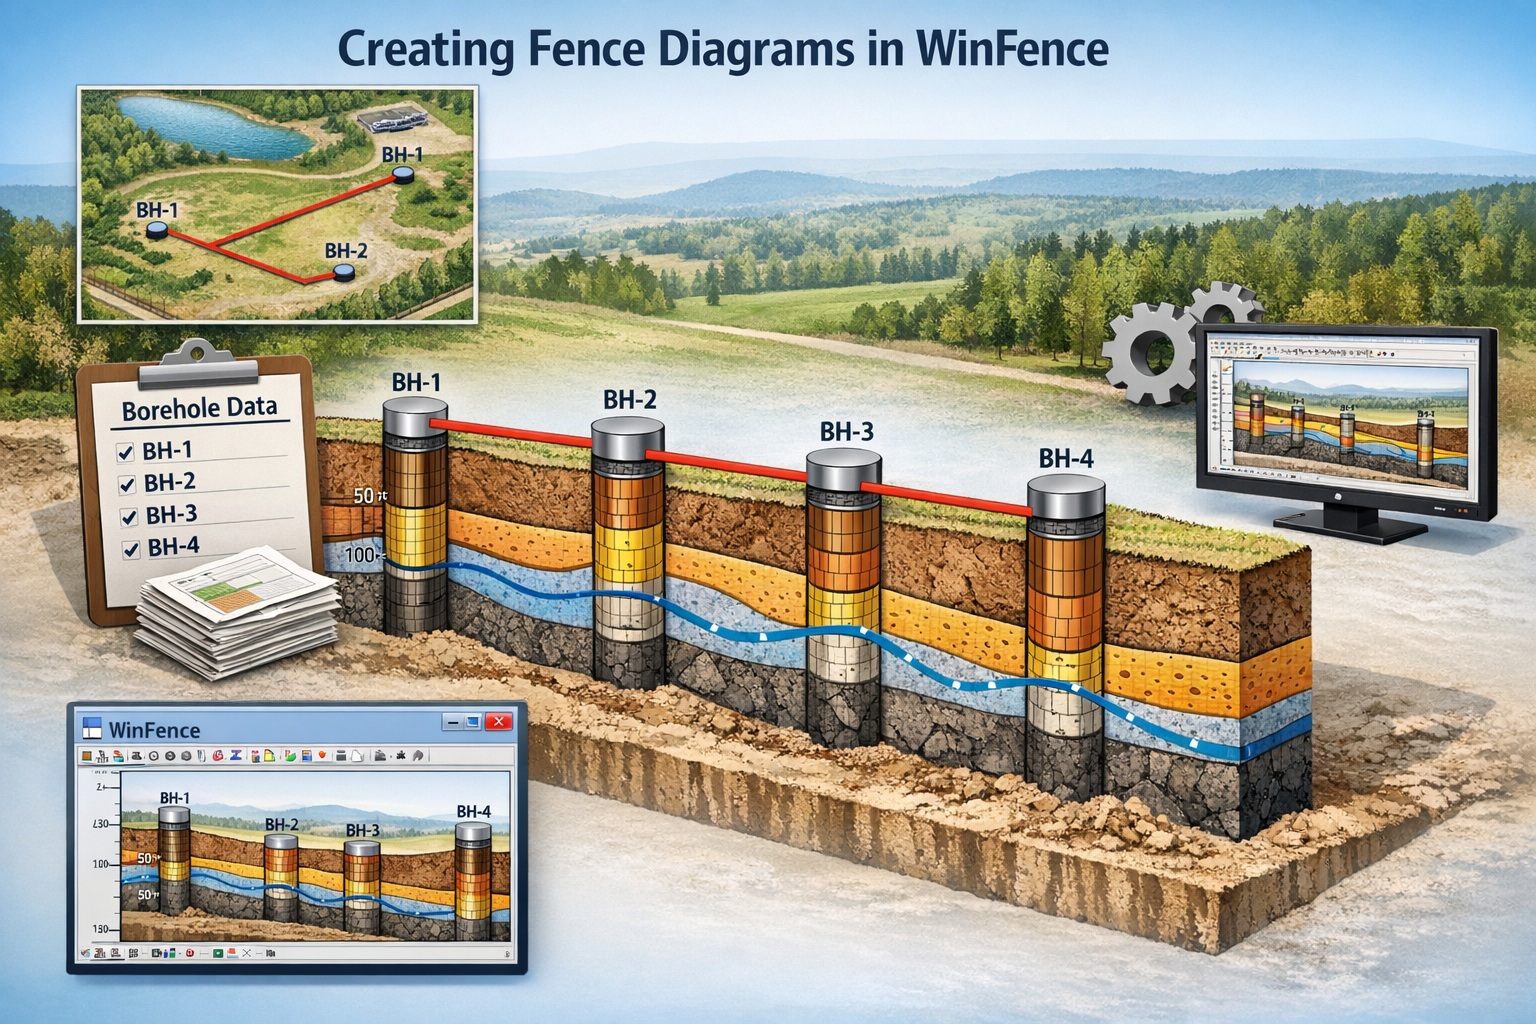
Fence diagrams connect multiple boreholes along defined alignments, allowing geoscientists and engineers to visualize how geological layers vary laterally. They transform isolated data points into a coherent subsurface model—revealing patterns, trends, and anomalies that are otherwise difficult to detect.
WinFence is a powerful tool designed specifically for this purpose. It enables users to generate detailed fence diagrams quickly and accurately, using borehole data from WinLoG.
In this guide, we walk through the complete process of creating fence diagrams in WinFence—from data preparation to final visualization—along with best practices to ensure clarity and accuracy.
What Is a Fence Diagram?
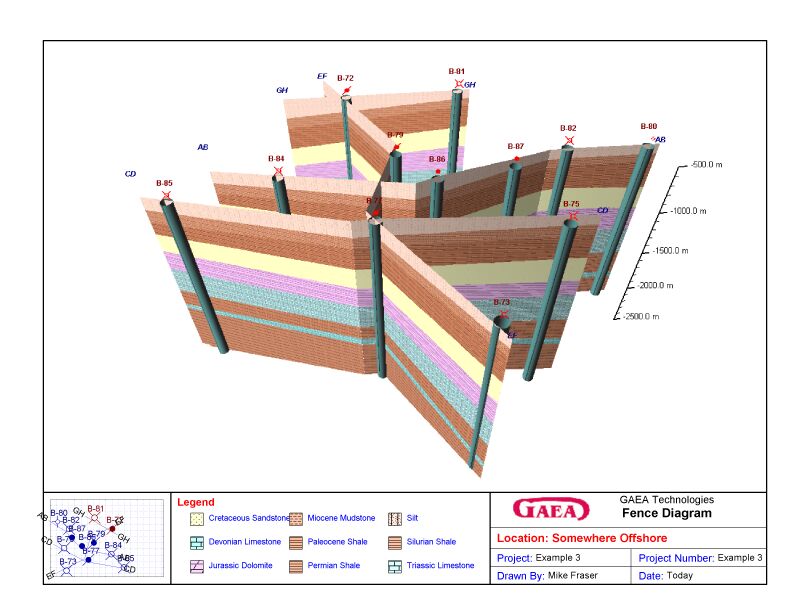
A fence diagram is a 3D representation of subsurface conditions created by connecting multiple cross-sections generated using borehole logs along a defined line or path.
Key Features of Fence Diagrams
- Displays lithology across multiple boreholes
- Shows lateral continuity of soil and rock layers
- Highlights stratigraphic relationships
- Integrates GIS, geotechnical and geophysical data
Why Fence Diagrams Matter
Fence diagrams are used to:
- Interpret subsurface geology
- Support engineering design
- Identify contamination pathways
- Communicate findings to stakeholders
Preparing Data for WinFence
Before creating a fence diagram, your data for the cross-sections must be properly prepared.
Data Requirements
To generate accurate fence diagrams, you need:
🔹 Borehole Coordinates
- X, Y locations
- Elevation
🔹 Lithology Data
- Depth intervals
- Material descriptions
🔹 Additional Data (Optional)
- SPT values
- Geophysical logs
- Groundwater levels
Data Quality Considerations
Ensure:
- Consistent units (meters or feet)
- Accurate elevations
- Standardized lithology descriptions
Why Preparation Is Critical
Poor data quality leads to:
- Misaligned layers
- Incorrect interpretations
- Misleading diagrams
Importing Borehole Data into WinFence
Once your data is ready, the next step is creating the cross-sections in WinFence.
Validation Checklist
- Borehole positions correct
- Depth intervals accurate
- Lithology properly structured
Creating a Fence Diagram
This is the core step where data becomes visualization. After the cross-sections have been created, create a new 3D View in the project. The cross-sections will automatically be added to the 3D view along with the boreholes.
Adjust Scaling
Set:
- Vertical exaggeration
- Horizontal scale
Why Scaling Matters
- Too much exaggeration distorts reality
- Too little hides important features
Interpreting Fence Diagrams
Fence diagrams are more than visuals—they are analytical tools.
What to Look For
🔹 Layer Continuity
Are layers continuous across the site?
🔹 Variability
Do materials change laterally?
🔹 Anomalies
Unexpected features or discontinuities
🔹 Groundwater Trends
Flow direction and levels
Applications
- Identifying weak soil zones
- Mapping contamination pathways
- Designing foundations
Advanced Features in WinFence
Multi-Fence Diagrams
Create multiple fence lines for:
- Complex sites
- Large datasets
3D Visualization
Some workflows allow:
- 3D subsurface modeling
- Enhanced spatial understanding
Integration with Other Tools
WinFence integrates with:
- Borehole logging software
- Databases
- GIS systems
Common Mistakes to Avoid
❌ Poor Data Quality
Leads to inaccurate diagrams
❌ Over-Interpolation
Creates unrealistic layers
❌ Inconsistent Lithology
Breaks continuity
❌ Overcomplicated Visuals
Reduces readability
Best Practices for Fence Diagram Creation
✔ Use High-Quality Data
Start with accurate borehole logs
✔ Standardize Lithology
Ensure consistency across datasets
✔ Choose Alignments Carefully
Align with project objectives
✔ Validate Results
Compare with field observations
✔ Keep Visuals Clear
Prioritize readability over complexity
Integrating Fence Diagrams into Workflows
Fence diagrams are a key component of larger workflows.
Typical Workflow
- Borehole logging
- Data structuring
- Visualization (WinFence)
- Analysis
- Reporting
Benefits
- Better interpretation
- Improved communication
- Stronger decision-making
Industry Applications
Geotechnical Engineering
- Foundation design
- Soil stratigraphy analysis
Environmental Consulting
- Contamination mapping
- Site assessments
Hydrogeology
- Aquifer characterization
- Groundwater flow analysis
Mining & Exploration
- Resource modeling
- Stratigraphic interpretation
Fence Diagrams and Digital Workflows
As geoscience workflows evolve, fence diagrams are becoming part of:
- Integrated data systems
- Automated reporting
- AI-driven analysis
Future Trends
- Real-time visualization
- Cloud-based data integration
- Advanced modeling tools
Conclusion
Fence diagrams are one of the most powerful tools for visualizing and interpreting subsurface conditions. By connecting borehole data into a continuous profile, they provide insights that are not possible from individual logs alone.
Using WinFence, geoscientists and engineers can quickly create accurate, customizable fence diagrams that support analysis, design, and reporting.
When combined with high-quality data and standardized workflows, fence diagrams become an essential component of modern geotechnical and environmental projects.
Related Articles
- Visualizing Stratigraphy Across Sites: A Complete Guide to Subsurface Correlation and Interpretation
- How Do I Use Project Views to Display Cross-Sections in GaeaSynergy?
- How Do I Create a Cross-Section in WinFence Using My WinLoG Data?
- How Do I Edit Strata Styles and Segments in WinFence?
- How do I Print or Export a Cross-section to a PDF in WinFence?
- How do I Add Strata to a Cross-section in WinFence?
- How do I Edit and Snap Boundaries in WinFence?