
Creating a clear geological profile is essential for communicating complex subsurface data. In subsurface data. In GaeaSynergy, Project Views serve as the central hub where individual cross-sections (often generated in the WinFence module) are integrated with maps and 3D models for a comprehensive site overview.
Steps to Display Cross-Sections in Project Views
Initialize Your Project View
To begin, you must create a container for your data. Navigate to File > New > Project View. You will be prompted to select a Project Template, which defines the initial layout and the types of data elements (like cross-sections) the view can contain.
Select and Add Cross-Sections
Once the view is created, GaeaSynergy will prompt you to choose from existing data elements.
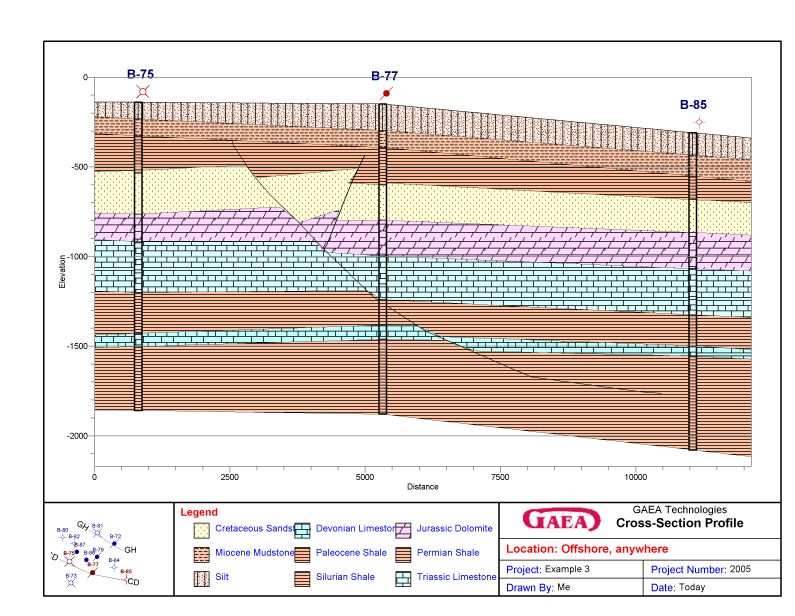
- From the List: Select the specific cross-sections you want to feature. These are typically those previously created using the “Pencil Tool” to draw paths between boreholes.
- Dynamic Linking: The cross-sections in your Project View are not static images; they are linked to the database. If you update a borehole log in WinLoG, the strata in your Project View’s cross-section will update automatically.
Spatial Alignment and Mapping
One of the most powerful features of Project Views is the ability to see exactly where your section lies in the physical world.
- Map Integration: Double-clicking a cross-section on the project map within the view will open that specific section for detailed editing.
- 3D Synergy: If your Project View includes a 3D display, your cross-sections can be rendered as 3D fence diagrams, allowing stakeholders to visualize how stratigraphic layers intersect with above-ground buildings or underground storage tanks.
Customizing the Display
Within the Project View, you can control how the section appears:
- Layer Visibility: Use the Section Tab in the GIS Toolbar to toggle specific layers on or off.
- Annotations: Add labels, charts, or legends directly to the Project View to provide context to the stratigraphic data.
Summary
GaeaSynergy uses Project Views to transform isolated 2D cross-sections into interactive, spatially-aware models. By selecting predefined cross-sections during the view creation process, engineers can display detailed subsurface profiles alongside maps and 3D structures, ensuring that every stratigraphic interpretation is backed by clear, multi-dimensional evidence.
Related Articles
- Creating Fence Diagrams in WinFence: A Complete Guide to Subsurface Visualization
- Visualizing Stratigraphy Across Sites: A Complete Guide to Subsurface Correlation and Interpretation
- How Do I Create a Cross-Section in WinFence Using My WinLoG Data?
- How Do I Edit Strata Styles and Segments in WinFence?
- How do I Print or Export a Cross-section to a PDF in WinFence?
- How do I Add Strata to a Cross-section in WinFence?
- How do I Edit and Snap Boundaries in WinFence?