
Introduction
Across the global subsurface industry, millions of historical well logs remain locked inside paper archives created during decades of oil and gas exploration. These vintage logs contain critical geophysical measurements such as gamma ray, resistivity, and sonic logs, which provide valuable insights into formation lithology, porosity, and reservoir characteristics.
Despite their importance, many of these logs exist only as paper prints, microfilm scans, or low-resolution images, making them difficult to integrate into modern geoscience workflows.
By digitizing and extracting data from these vintage logs, geoscientists can transform archival records into structured digital datasets compatible with modern interpretation software, reservoir modeling tools, and machine learning systems.
This article explores:
- Why vintage well log data still matters
- The importance of gamma ray, resistivity, and sonic logs
- Methods for extracting curves from historical logs
- Software tools used in log digitization
- Quality control procedures
- Best practices for building reliable digital datasets
Digitizing vintage well logs is not simply a data preservation exercise—it is a strategic process that unlocks decades of subsurface knowledge for modern analysis.
Why Vintage Well Logs Still Matter
Historical well logs represent some of the most detailed subsurface measurements ever collected.
During exploration drilling campaigns in the mid-20th century, logging service companies recorded a wide range of geophysical properties, often producing multi-track paper log prints spanning tens of meters in length.
Although these records are decades old, they remain extremely valuable because they provide:
- Direct measurements of formation properties
- Lithological interpretation data
- Reservoir quality indicators
- Depth correlations between wells
Modern exploration and subsurface analysis increasingly relies on integrated digital datasets, yet large portions of legacy well log archives remain inaccessible because they have not been digitized.
Extracting geophysical measurements from vintage logs allows organizations to:
- Improve reservoir models
- Evaluate geothermal potential
- Support carbon capture storage (CCS) studies
- Enhance basin-scale geological understanding
- Train machine learning models
In many cases, re-drilling wells to reproduce these measurements would be impossible or prohibitively expensive, making digitization the only practical way to recover this information.
The Role of Gamma Ray, Resistivity, and Sonic Logs
Among the many measurements recorded during well logging operations, three logs are particularly valuable for geological interpretation.
These include:
- Gamma ray logs
- Resistivity logs
- Sonic logs
Each provides unique information about subsurface formations.
Gamma Ray Logs
Gamma ray logs measure the natural radioactivity of rocks surrounding the borehole.
Sedimentary rocks containing clay minerals, such as shale, typically exhibit higher levels of radioactivity compared to sandstones or carbonates.
Because of this relationship, gamma ray logs are commonly used to:
- Identify shale versus clean reservoir rock
- Detect formation boundaries
- Correlate stratigraphic units between wells
In vintage logs, gamma ray curves are usually displayed as continuous curves across a depth track, often with a measurement scale expressed in API units.
Digitizing these curves allows geoscientists to reconstruct detailed lithology indicators across the wellbore.
Resistivity Logs
Resistivity logs measure the electrical resistance of formations surrounding the borehole.
This property is critical for identifying hydrocarbon-bearing zones because:
- Water conducts electricity
- Hydrocarbons resist electrical flow
High resistivity values may indicate the presence of oil or gas.
Resistivity logs are also used for:
- Formation evaluation
- Water saturation calculations
- Reservoir characterization
Vintage well logs often contain multiple resistivity measurements, such as:
- Shallow resistivity
- Deep resistivity
- Induction logs
- Laterolog measurements
Digitizing these curves allows petrophysicists to perform modern formation evaluation techniques on historical wells.
Sonic Logs
Sonic logs measure the travel time of acoustic waves through rock formations.
These logs provide insight into rock properties such as:
- Porosity
- Lithology
- Mechanical strength
Sonic logs are widely used in:
- Seismic calibration
- Formation evaluation
- Geomechanical modeling
In modern workflows, sonic data plays an important role in linking well data to seismic datasets.
Digitizing vintage sonic logs allows geoscientists to incorporate historical wells into modern seismic interpretation and velocity modeling workflows.
Challenges of Extracting Data from Vintage Logs
Although historical well logs contain valuable information, extracting usable data from them can be challenging.
Several issues commonly arise during digitization.
Paper Deterioration
Many archival logs were printed decades ago on paper that has since deteriorated.
Common problems include:
- Faded ink
- Yellowing paper
- Tears and fold marks
- Water damage
These issues can make curve detection difficult.
Low Quality Scans
Older scanning projects often produced low-resolution images.
Poor scans may include:
- Blurry curves
- Distorted depth scales
- Missing track sections
High-resolution rescanning may be required before digitization.
Multiple Curves per Track
Well logs frequently contain multiple curves within the same track.
For example, a resistivity track may include several measurements plotted simultaneously.
Separating these curves requires careful interpretation.
Inconsistent Log Layouts
Logging service companies historically used different layouts and scales.
Vintage logs may vary in:
- Track width
- Measurement units
- Depth intervals
- Curve color schemes
Digitization workflows must adapt to these variations.
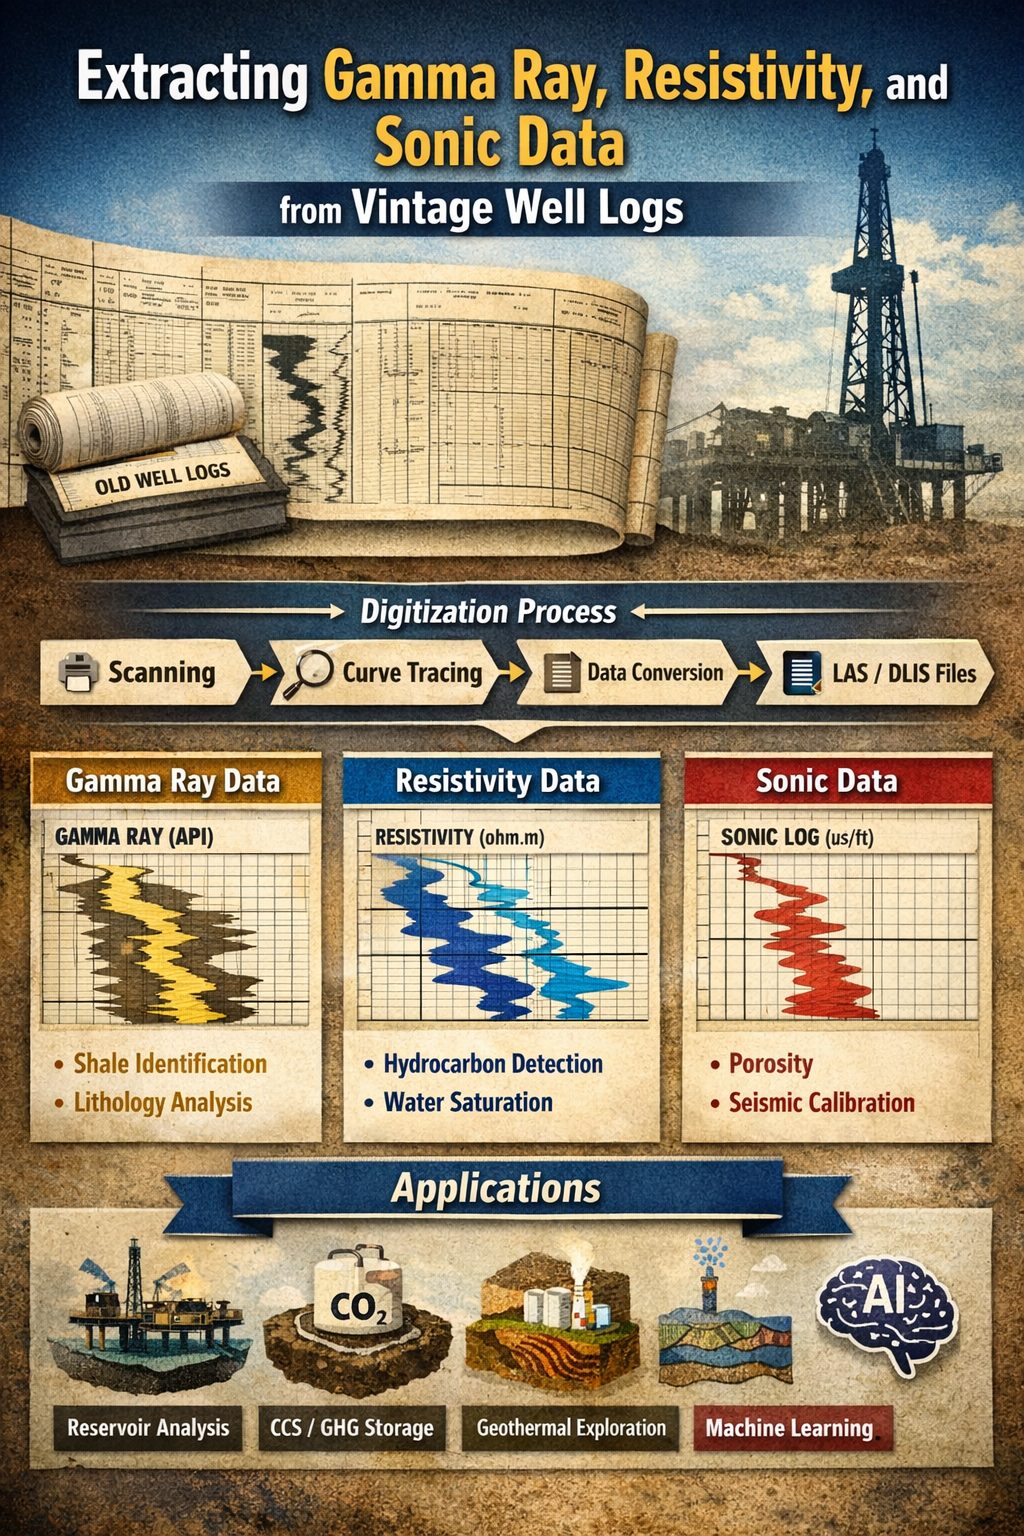
The Well Log Curve Extraction Workflow
Extracting gamma ray, resistivity, and sonic data from vintage logs typically follows a structured workflow.
Step 1: Scanning the Original Log
The first step is converting paper logs into high-resolution digital images.
Large-format scanners are used to capture detailed images of the log.
Recommended scanning settings include:
- 300–600 DPI resolution
- Lossless image formats such as TIFF
- Accurate color capture for curve differentiation
High-quality scans ensure that curves remain visible and accurate.
Step 2: Image Preprocessing
Before curves can be extracted, scanned images must be prepared.
This preprocessing stage may involve:
- Straightening skewed images
- Adjusting brightness and contrast
- Removing scanning artifacts
- Cropping unnecessary margins
Image enhancement improves the accuracy of curve detection.
Step 3: Depth Calibration
Digitization software must establish a depth reference system before extracting curves.
Technicians identify:
- Depth markers
- Grid intervals
- Reference points
This ensures the digitized curves match the correct depth values.
Step 4: Track Identification
Vintage well logs typically contain several tracks.
For example:
Track 1 – Depth scale
Track 2 – Gamma ray log
Track 3 – Resistivity logs
Track 4 – Sonic log
Each track must be isolated before digitization begins.
Step 5: Curve Digitization
Once tracks are defined, the actual curve extraction begins.
This step converts the graphical curve into numerical data points.
Several methods are used.
Manual Curve Digitization
Manual digitization involves tracing the curve using specialized software.
Advantages include:
- High accuracy
- Good control over complex curves
However, manual digitization can be slow for large datasets.
Semi-Automated Digitization
Semi-automated tools detect curves automatically but allow manual correction.
This approach offers a balance between speed and accuracy.
It is commonly used in large digitization projects.
AI-Based Curve Extraction
Recent advances in machine learning allow automated detection of log curves.
AI tools can:
- Identify curves
- Separate overlapping lines
- Extract numerical data
These tools are rapidly improving and can significantly reduce processing time.
Step 6: Data Export
After curves are digitized, the data is exported into structured formats.
Common output formats include:
- LAS (Log ASCII Standard)
- CSV
- DLIS
- Database formats
These files can then be imported into interpretation software.
Tools Used for Well Log Data Extraction
Several types of software support well log digitization.
Log Digitization Software
These specialized tools allow technicians to extract curves from scanned logs.
Typical features include:
- Curve tracing tools
- Automatic curve detection
- Depth calibration
- Data smoothing
- Multi-track support
Image Processing Tools
Image editing software helps improve scan quality before digitization.
Capabilities include:
- Noise removal
- Color enhancement
- Image alignment
- Grid detection
Geological Interpretation Software
After digitization, well log data is imported into interpretation platforms.
These systems allow geoscientists to perform:
- Petrophysical analysis
- Reservoir modeling
- Formation correlation
- Seismic calibration
Quality Control in Curve Extraction
Quality control is critical to ensure digitized data accurately reflects the original log.
Several validation steps are typically performed.
Visual Curve Comparison
Digitized curves are compared against the original image to confirm alignment.
Technicians verify that the extracted curve matches the original trace.
Depth Verification
Depth calibration must be validated to ensure measurements correspond to the correct intervals.
Incorrect depth calibration can cause significant interpretation errors.
Curve Smoothing
Digitization may introduce small fluctuations or noise.
Smoothing algorithms can correct these artifacts while preserving the original trend.
Cross-Log Correlation
When multiple wells are digitized, curves can be correlated across wells.
This helps identify potential digitization errors.
Applications of Digitized Gamma Ray, Resistivity, and Sonic Logs
Once extracted, vintage well log data can support numerous modern applications.
Reservoir Characterization
Digitized logs allow geoscientists to evaluate:
- Porosity
- Water saturation
- Net pay zones
These parameters are essential for reservoir modeling.
Seismic Integration
Sonic logs are particularly useful for linking well data with seismic datasets.
This improves:
- Velocity modeling
- Seismic inversion
- Structural interpretation
Carbon Capture and Storage (CCS)
Resistivity and sonic logs help evaluate formations suitable for CO₂ storage.
These logs provide information about:
- Porosity
- Permeability
- Cap rock integrity
Geothermal Resource Evaluation
Gamma ray and resistivity logs can help identify geothermal reservoirs by indicating rock properties and lithology.
Digitized logs allow geothermal projects to leverage existing oil and gas wells.
Machine Learning Applications
Large digitized log datasets can be used to train AI models that automate geological interpretation.
These models can identify:
- Lithology patterns
- Formation tops
- Reservoir zones
Best Practices for Digitizing Vintage Well Logs
Organizations planning digitization projects should follow several best practices.
Use High-Resolution Scanning
Low-resolution images reduce digitization accuracy.
Scanning at 300–600 DPI preserves curve detail.
Preserve Original Images
Always archive the original scanned logs alongside digitized datasets.
This ensures traceability.
Standardize Data Formats
Using formats like LAS improves compatibility with interpretation software.
Capture Complete Metadata
Metadata should include:
- Well name
- Location
- Logging date
- Tool type
- Depth reference
Metadata improves future usability.
Conclusion
Vintage well logs contain a wealth of geophysical information that remains invaluable for modern subsurface analysis.
By extracting gamma ray, resistivity, and sonic data from historical logs, organizations can transform archival records into structured digital datasets ready for modern workflows.
Through careful scanning, curve extraction, quality control, and data management, these logs can support applications ranging from reservoir characterization to geothermal exploration and carbon capture site evaluation.
As digital technologies and machine learning continue to reshape geoscience workflows, the digitization of historical well logs will play an increasingly important role in unlocking decades of subsurface knowledge.
Learn more about our Data Solutions
- Geophysical and well log digitization
- Seismic section digitization
- Map digitization
- Core photo splicing
- Scout ticket digitization
Related Articles
- Data Digitization and Management Solutions for Geoscience and Engineering
- Quality Control and Validation in Geophysical Well Log Digitization
- Scanning and Structuring Historical Borehole Logs for Digital Analysis
- Extracting Gamma Ray, Resistivity, and Sonic Data from Vintage Well Logs
- From Weeks To Seconds: How Digitized Well Logs Accelerate Reservoir Rock Mapping
- How to View, Compare, and Summarize LAS Files for Free with GAEA Technologies
- Mastering the Code: A Guide to Common Geophysical Curve Abbreviations
- Unlocking Hidden Reserves: Using 3D Visualization of Digital Logs to Find Bypassed Pay Zones
- Why Physical Well Logs Are a Ticking Time Bomb: Preventing Data Loss from Paper Deterioration
- 5 Steps To Convert Your Archive Into An AI-Ready Geospatial Pipeline
- Uncovering the Untapped Potential of Old Well Logs in Carbon Capture and Geothermal Projects
- LAS vs. LIS vs. DLIS: A Geoscientist’s Guide to Digital Well Log Output Formats
- LAS, SEGY, and Beyond: Ensuring Interoperability For Your Newly Digitized Assets
- The Lifecycle of a Well Log: From Mud Logging to Digital Asset
- Asset Preservation: Protecting Your Subsurface Intellectual Property from Physical Deterioration
- The Origin of the LAS Format for Well Logs