
Ever stared at a Log ASCII Standard (LAS) file and felt like you were reading an ancient cypher? You aren’t alone. Geophysical logs are packed with mnemonics—short-form abbreviations that represent complex borehole measurements. Understanding these is critical for accurate petrophysical analysis and reservoir characterization.
In this guide, we break down the most common geophysical curve abbreviations you’ll encounter in the field.
The “Big Three”: Lithology and Porosity
Most logging suites begin with these fundamental curves to identify rock types and fluid-holding capacity.
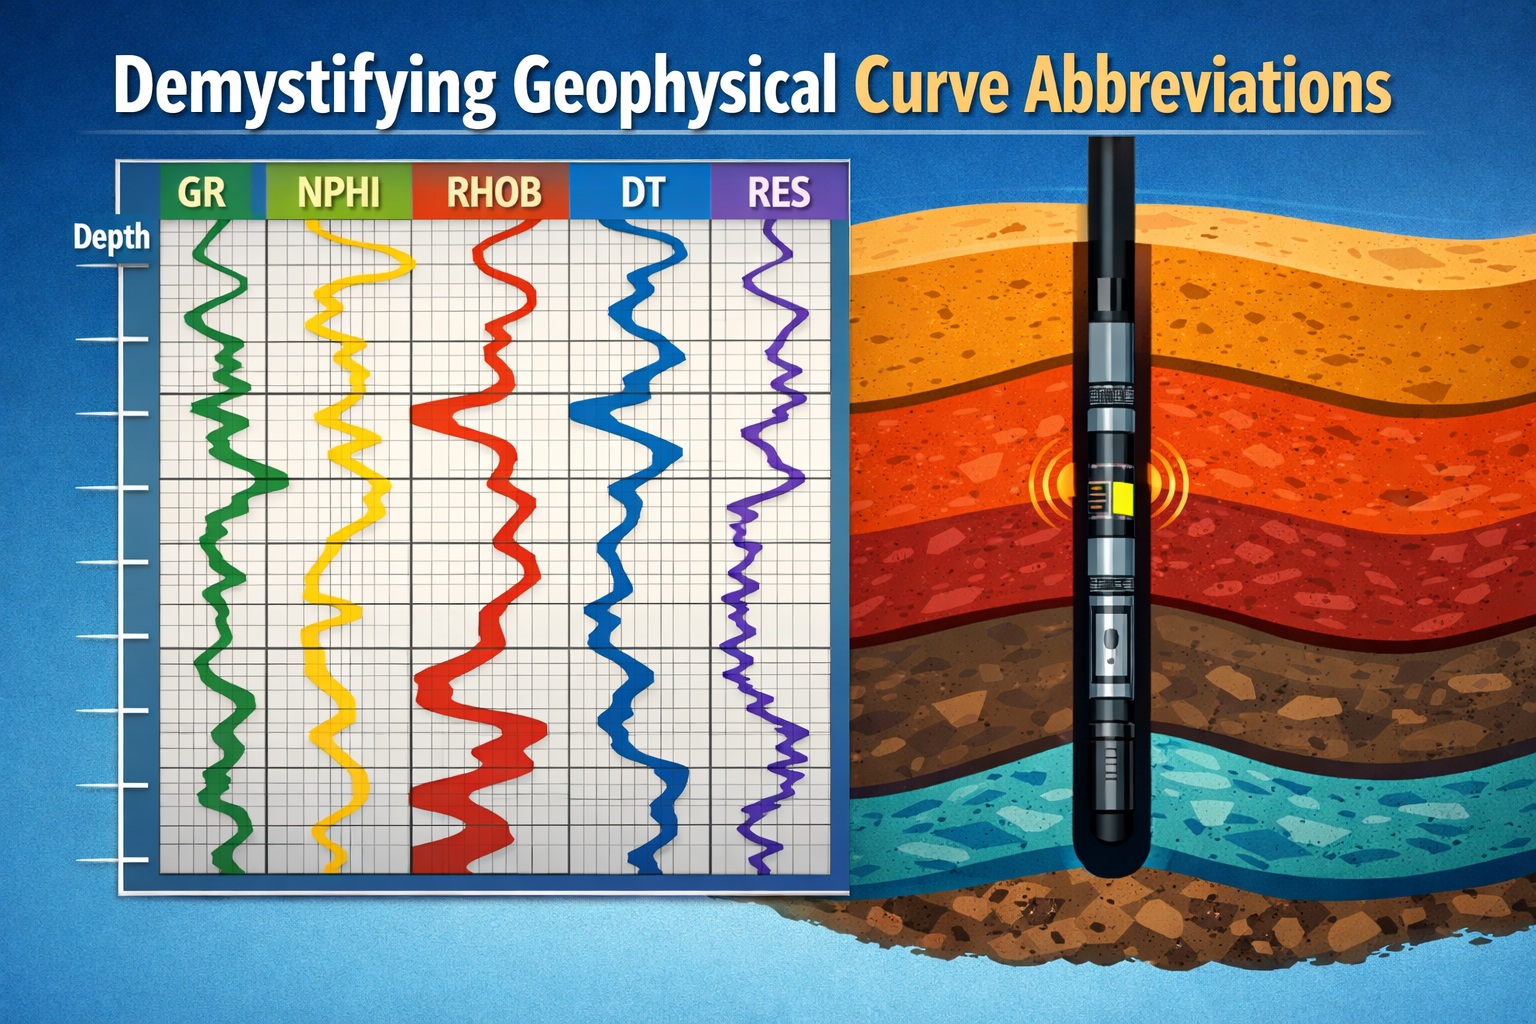
- GR (Gamma Ray): Measures natural radioactivity. High readings typically indicate shales, while low readings suggest “clean” sandstones or carbonates.
- RHOB (Bulk Density): Represents the density of the formation. Often used alongside NPHI to determine porosity and lithology.
- NPHI (Neutron Porosity): Measures the hydrogen index in the formation, primarily used as a proxy for porosity.
Resistivity: Finding the Hydrocarbons
Resistivity curves help distinguish between water-saturated zones and those containing oil or gas.
- RT (True Resistivity): The deep-reading measurement of the uninvaded zone.
- ILD / LLD (Induction Deep / Laterolog Deep): Specific tool-dependent abbreviations for deep resistivity.
- RXO (Flushed Zone Resistivity): Measures the area near the borehole wall where drilling mud has displaced original fluids.
Mechanical and Auxiliary Curves
These curves provide vital context about the borehole environment.
- CALI (Caliper): Measures the diameter of the borehole. Crucial for identifying “washouts” or “filter cakes”.
- SP (Spontaneous Potential): Measures the natural electric potential between the borehole fluid and the formation.
- DT (Sonic / Delta-T): Represents the interval transit time of sound waves. Used for seismic tie-ins and calculating sonic porosity.
Spectral Gamma Ray (SGR)
While a standard Gamma Ray (GR) log gives the total natural radioactivity, spectral logs decompose this into its three primary sources.
- THOR (or TH): Thorium concentration in parts per million (ppm). It is often associated with heavy minerals and continental shales.
- URAN (or U): Uranium concentration (ppm). High uranium is a common indicator of organic-rich source rocks.
- POTA (or K): Potassium concentration in percentage (%). It helps identify specific clay types like illite or potash minerals.
- CGR (Computed Gamma Ray): The total gamma ray signal minus the contribution from Uranium (
). This is often a better indicator of clay content than the standard total log.
Elemental Spectroscopy (Geochemical) Logs
These tools (e.g., Schlumberger’s LithoScanner) use neutron capture to determine the elemental weight fractions of the rock matrix.
- CSI (Silicon): Used to identify sandstones and cherts.
- CCA (Calcium): Primary indicator for limestones and calcitic cements.
- CFE (Iron): Helps identify siderite, pyrite, and iron-rich clays.
- CSUL (Sulfur): Key for detecting anhydrite or gypsum.
- LIR (Lithology Indicator Ratio): Often a calculated ratio of
used to differentiate between siliciclastics and carbonates.
Nuclear Magnetic Resonance (NMR)
NMR tools measure the relaxation time of hydrogen protons, providing a “spectrum” of pore sizes.
- TCMR (Total CMR Porosity): The total fluid-filled porosity from magnetic resonance.
- BVI (Bound Volume Irreducible): Fluid held in tiny pores by capillary forces that will not flow.
- FFI (Free Fluid Index): The volume of fluid in larger pores that is potentially producible.
- Spectrum: The primary output showing the distribution of decay times, which serves as a proxy for pore size distribution.
Array Induction & Advanced Resistivity
Instead of one “deep” reading, these provide a spectrum of radial depths into the formation.
- AT10, AT30, AT90: Resistivity at 10, 30, and 90 inches of radial investigation. Comparing these (the “invasion profile”) tells you how much drilling fluid has leaked into the rock.
Advanced Spectral Curve Comparison Table
| Measurement Category | Schlumberger (SLB) | Halliburton (HAL) | Baker Hughes (BKR) | Common / Generic |
|---|---|---|---|---|
| Spectral Gamma (Thorium) | THOR | TH | THOR | THOR / TH |
| Spectral Gamma (Potassium) | POTA | K | POTA | POTA / K |
| Spectral Gamma (Uranium) | URAN | U | URAN | URAN / U |
| Lithology / Geochemistry | LithoScanner / ECS | GEM / EcoScope | FLEX | Elemental |
| Total NMR Porosity | TCMR | MPHI | TPOR | TCMR / PHIT_NMR |
| NMR Free Fluid | FFI | MFFI | MPRM | FFI |
| Bound Water (NMR) | BVI | MBVI | MBVI | BVI |
| Array Resistivity (Deep) | AT90 / RL90 | RLA5 | AIT90 | RESD / RT |
| Array Resistivity (Shallow) | AT10 / RL10 | RLA1 | AIT10 | RESS / RXO |
| Sonic (Compressional) | DT / DTC | DT | DT | DT / DTC |
| Sonic (Shear) | DTS / DTSM | DTS | DTS | DTS |
Key Differences in Identification
- Acoustic Logs: While DT is the near-universal standard for compressional slowness, shear wave mnemonics vary more widely, often appearing as DTS, DTSM (Dipole Shear), or DT4P/DT4S depending on the specific tool array.
- Resistivity Arrays: Schlumberger’s AIT (Array Induction Tool) uses AT prefixes followed by numerical depths (e.g., AT90), whereas Halliburton often uses RLA (Resistivity Log Array) for similar measurements.
- Geochemical Logs: These are the most proprietary. For example, SLB’s ECS (Elemental Capture Spectroscopy) and HAL’s GEM (Gas Evolution Measurement) both provide weight fractions for Silicon, Calcium, and Iron, but their internal channel names for “uncertainty” and “quality” factors differ significantly.
Pro Tip: Case Sensitivity Matters
In many petrophysical software packages, UPPER CASE mnemonics (like DENS) represent raw input logs, while Mixed Case (like PhiE) often denotes calculated output results.
Learn more about our Data Solutions
- Geophysical and well log digitization
- Seismic section digitization
- Map digitization
- Core photo splicing
- Scout ticket digitization
Related Articles
- Data Digitization and Management Solutions for Geoscience and Engineering
- Quality Control and Validation in Geophysical Well Log Digitization
- Scanning and Structuring Historical Borehole Logs for Digital Analysis
- Extracting Gamma Ray, Resistivity, and Sonic Data from Vintage Well Logs
- From Weeks To Seconds: How Digitized Well Logs Accelerate Reservoir Rock Mapping
- How to View, Compare, and Summarize LAS Files for Free with GAEA Technologies
- Mastering the Code: A Guide to Common Geophysical Curve Abbreviations
- Unlocking Hidden Reserves: Using 3D Visualization of Digital Logs to Find Bypassed Pay Zones
- Why Physical Well Logs Are a Ticking Time Bomb: Preventing Data Loss from Paper Deterioration
- 5 Steps To Convert Your Archive Into An AI-Ready Geospatial Pipeline
- Uncovering the Untapped Potential of Old Well Logs in Carbon Capture and Geothermal Projects
- LAS vs. LIS vs. DLIS: A Geoscientist’s Guide to Digital Well Log Output Formats
- LAS, SEGY, and Beyond: Ensuring Interoperability For Your Newly Digitized Assets
- The Lifecycle of a Well Log: From Mud Logging to Digital Asset
- Asset Preservation: Protecting Your Subsurface Intellectual Property from Physical Deterioration
- The Origin of the LAS Format for Well Logs