
Introduction
Borehole investigations provide some of the most valuable data used to understand subsurface geology. Engineers, geologists, and environmental scientists rely on borehole logs to interpret soil stratigraphy, evaluate groundwater systems, and analyze geological structures beneath project sites.
However, borehole logs are typically recorded as vertical data tables describing depth intervals and material types. While these logs provide detailed information about conditions at specific drilling locations, they do not easily reveal how geological layers extend across a site.
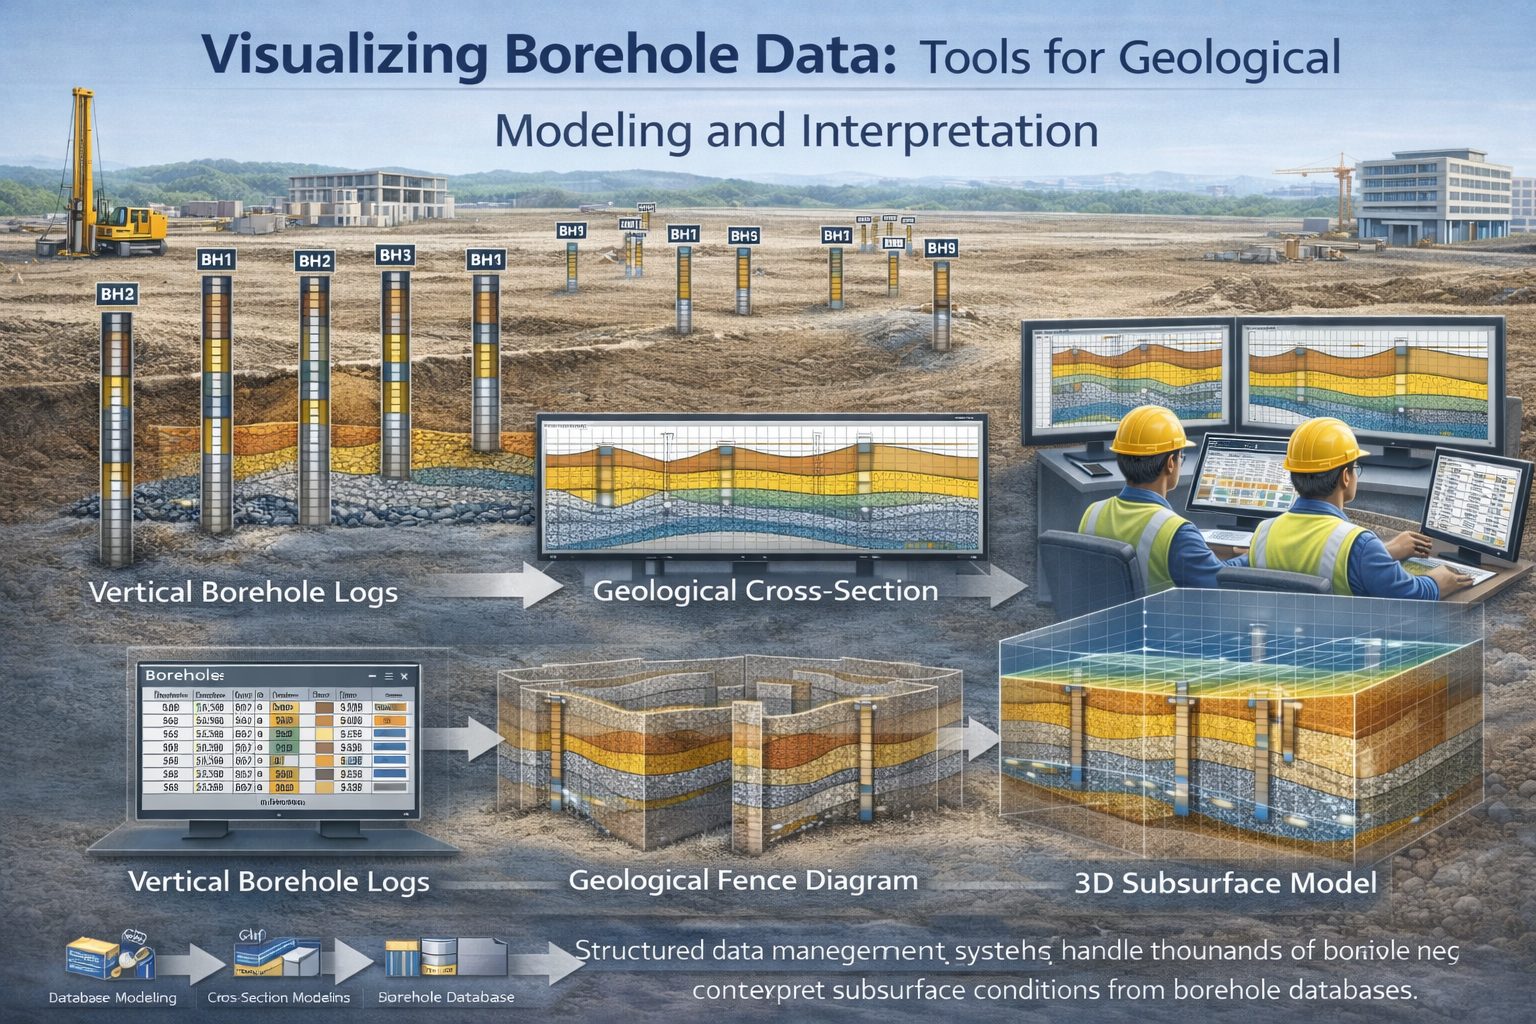
To interpret subsurface conditions effectively, borehole data must be visualized using graphical tools. Visualization techniques transform borehole datasets into diagrams, cross-sections, maps, and three-dimensional models that allow engineers and geologists to observe patterns within the subsurface.
Modern geological software and digital data management systems make it possible to visualize borehole data in ways that were not possible with traditional manual drafting techniques. These tools help professionals analyze complex geological conditions and communicate subsurface interpretations to project stakeholders.
This article explores the most common borehole data visualization techniques used in geological modeling and explains how these tools help interpret subsurface geology.
Why Visualization Is Important for Borehole Data
Borehole data is inherently complex. Each borehole contains multiple layers, each with different geological characteristics.
When dozens or even hundreds of boreholes are drilled across a site, interpreting the data becomes difficult without visual tools.
Visualization helps transform raw data into meaningful insights by allowing geologists and engineers to:
- identify geological patterns
- detect stratigraphic relationships
- analyze subsurface variability
- communicate geological interpretations
Without visualization, borehole data remains a collection of disconnected observations.
Visualization connects these observations into a coherent geological model.
Borehole Log Visualization
The most basic visualization technique is the borehole log diagram.
Borehole logs display vertical sequences of geological layers encountered during drilling. Each lithology interval is represented using symbols, colors, or patterns that correspond to different soil or rock types.
Typical borehole log diagrams show:
- depth scale
- lithology intervals
- sample locations
- groundwater observations
These diagrams provide a clear representation of the vertical stratigraphy at each borehole location.
Although borehole logs provide valuable information, they do not show how geological layers extend between boreholes. Additional visualization techniques are required to interpret regional geology.
Geological Cross-Sections
Geological cross-sections are one of the most widely used methods for visualizing borehole data.
A cross-section represents a vertical slice through the subsurface along a defined section line.
To construct a cross-section, borehole logs are plotted along the section line and geological layers are correlated between boreholes.
Cross-sections allow geologists to visualize:
- layer continuity
- thickness variations
- geological structures
- groundwater levels
Cross-sections transform individual borehole logs into continuous interpretations of subsurface geology.
Because they provide clear visual representations of geological conditions, cross-sections are widely used in engineering reports and geological studies.
Fence Diagrams
Fence diagrams extend the concept of cross-sections by combining multiple intersecting sections into a three-dimensional framework.
Instead of viewing the subsurface along a single line, fence diagrams allow geologists to analyze geological layers across multiple directions.
Fence diagrams are particularly useful for identifying complex geological features such as:
- buried river channels
- sediment lenses
- erosional surfaces
- structural deformation
These diagrams provide a better understanding of geological variability across a site.
Fence diagrams often serve as an intermediate step in the development of three-dimensional geological models.
Borehole Location Maps
Mapping borehole locations is another important visualization technique.
Borehole maps display the spatial distribution of boreholes across a project area.
These maps typically include:
- borehole coordinates
- site boundaries
- geological features
- topographic data
Borehole maps help engineers and geologists evaluate whether drilling coverage is sufficient to characterize subsurface conditions.
They also help identify areas where additional boreholes may be needed.
Geographic Information Systems (GIS) are commonly used to create borehole location maps.
Lithology Distribution Maps
Lithology distribution maps visualize the spatial distribution of specific geological materials.
For example, a map may show the thickness or elevation of a sand layer across a site.
These maps are created using interpolation techniques that estimate geological layer boundaries between boreholes.
Lithology maps can help identify geological features such as aquifers or clay layers that influence engineering design.
Hydrogeologists frequently use lithology maps to analyze groundwater flow systems.
3D Geological Models
Three-dimensional geological models provide the most advanced form of borehole data visualization.
These models use borehole data to generate surfaces representing geological boundaries.
For example, a model may include surfaces representing:
- the top of a clay layer
- the base of a sand deposit
- the bedrock surface
These surfaces are combined to create a three-dimensional representation of subsurface geology.
3D models allow engineers and geologists to explore geological structures from multiple perspectives.
They are particularly useful for complex geological environments where traditional cross-sections may not provide sufficient insight.
Borehole Fence and Panel Views
Many geological software platforms include borehole fence views or panel views.
These visualizations display multiple borehole logs side by side without connecting geological layers.
This approach allows geologists to examine lithology variations across multiple boreholes before interpreting layer correlations.
Fence views are often used as a preliminary step before constructing cross-sections.
They help identify patterns and potential correlations in the borehole data.
Color Coding and Symbolization
Effective visualization relies on clear graphical representation of geological materials.
Different lithologies are typically represented using standardized colors or patterns.
For example:
- clay may be represented by brown shading
- sand may be represented by yellow
- gravel may be represented by orange
- bedrock may be represented by gray
Consistent symbolization helps users quickly interpret geological diagrams.
Many geological software platforms include built-in lithology symbol libraries.
Digital Visualization Tools
Modern geological workflows rely heavily on digital visualization tools.
These tools allow engineers and geologists to generate visualizations automatically from borehole databases.
Common capabilities include:
- interactive cross-section generation
- three-dimensional modeling
- dynamic borehole log display
- GIS integration
Digital tools make it easier to update geological models when new borehole data becomes available.
They also allow teams to collaborate more effectively by sharing digital models.
Challenges in Borehole Data Visualization
Although visualization tools provide powerful insights, several challenges can arise.
Data Quality Issues
Errors in borehole databases can produce misleading visualizations.
For example, incorrect coordinates or depth intervals may distort cross-sections.
Overinterpretation
Visualizations may give the impression that geological models are more precise than they actually are.
In reality, geological interpretations between boreholes contain uncertainty.
Software Limitations
Automated visualization tools may generate unrealistic correlations if borehole data is inconsistent.
Human review remains essential.
Best Practices for Borehole Data Visualization
Several best practices help ensure that borehole visualizations are accurate and informative.
First, ensure that borehole data is carefully validated before generating visualizations.
Second, use consistent lithology classification systems.
Third, create multiple cross-sections across the site to analyze geological conditions from different directions.
Fourth, combine visualization methods such as maps, cross-sections, and 3D models.
Finally, clearly communicate uncertainty in geological interpretations.
Following these practices improves the reliability of subsurface visualization.
Applications of Borehole Visualization
Borehole data visualization supports many engineering and environmental applications.
Geotechnical Engineering
Visualization tools help engineers evaluate soil stratigraphy and design foundations.
Hydrogeology
Hydrogeologists use visualizations to analyze aquifer geometry and groundwater flow pathways.
Environmental Investigations
Environmental scientists use borehole visualizations to track contaminant migration through soil and groundwater.
Mining and Resource Exploration
Mining geologists use borehole visualizations to interpret ore deposits and plan exploration drilling.
Conclusion
Borehole data visualization is a critical component of geological interpretation and engineering analysis. Raw borehole logs provide valuable information about subsurface conditions, but visualization techniques are needed to transform this data into meaningful geological models.
Techniques such as borehole logs, cross-sections, fence diagrams, maps, and three-dimensional models allow engineers and geologists to interpret subsurface patterns and communicate their findings effectively.
Modern digital tools have greatly improved the ability to visualize borehole data, but accurate interpretation still depends on high-quality data and geological expertise.
By combining multiple visualization techniques and following best practices for data management, professionals can develop reliable subsurface models that support engineering design and environmental management.
Learn more about our Solutions
- GaeaSynergy Platform for Geoscientific Analysis
- WinLoG Borehole and Well Log Data Management
- WinFence Cross-section and Fence Diagram Visualization
Related Articles
- GaeaSynergy: Integrated Geological, Geotechnical, and Environmental Data Management Platform
- Subsurface Visualization: Turning Borehole Data into Clear Geological Insight
- Geological Cross-Sections from Borehole Data: A Complete Engineering Guide
- Common Mistakes When Creating Geological Cross-Sections from Borehole Data
- How Borehole Spacing Affects Geological Cross-Section Accuracy
- Preparing Borehole Databases for Cross-Section Software
- How Lithological Correlation Works Between Boreholes
- Understanding Fence Diagrams in Geological Modeling
- Common Data Errors in Borehole Databases and How to Fix Them
- Using Geological Cross-Sections in Geotechnical Engineering
- Borehole Coordinate Systems and Mapping for Geological Modeling
- Depth vs Elevation in Borehole Databases for Geological Modeling
- Interpreting Geological Variability Between Boreholes
- Building Geological Cross-Sections from Borehole Data: A Step-by-Step Workflow
- How Geological Software Interpolates Subsurface Layers Between Boreholes
- Managing Large Borehole Data Sets in Engineering Projects
- Understanding Pinch-Outs and Missing Geological Layers in Subsurface Interpretation