
Introduction
Geologists and engineers rely on visual tools to interpret subsurface conditions that cannot be directly observed from the surface. Borehole drilling provides valuable vertical information about soil and rock layers, but understanding how those layers extend across a site requires additional interpretation.
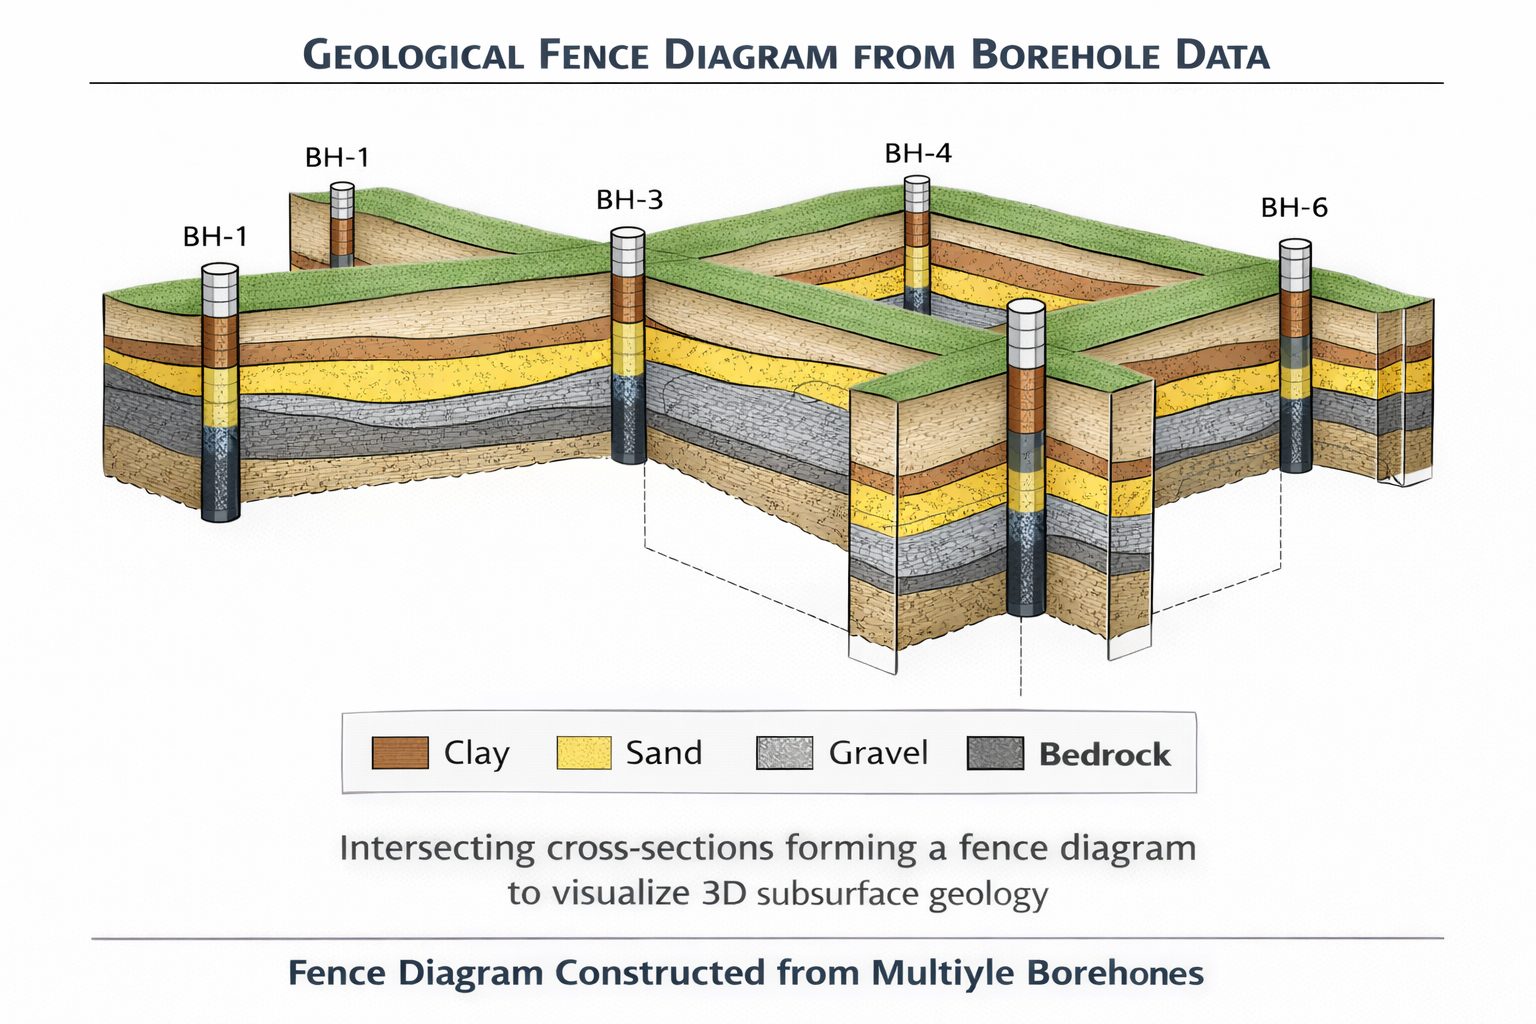
One of the most effective tools used for this purpose is the geological fence diagram. Fence diagrams combine multiple geological cross-sections to create a three-dimensional framework of subsurface geology. Instead of viewing a single vertical slice through the Earth, fence diagrams allow geologists to examine geological layers in multiple directions across an investigation area.
By connecting cross-sections that intersect across a site, fence diagrams provide insight into how geological units extend laterally and how they vary across the subsurface. These diagrams help identify important geological features such as buried channels, sediment lenses, erosional surfaces, and pinch-outs.
Fence diagrams are widely used in geotechnical engineering, hydrogeology, environmental investigations, and mining exploration. They allow professionals to visualize complex subsurface conditions and communicate geological interpretations to engineers, planners, and decision makers.
With the advancement of geological modeling software, fence diagrams can now be generated digitally from borehole databases. These tools allow geologists to construct detailed visualizations of subsurface stratigraphy and explore geological models from multiple perspectives.
This article explains how fence diagrams work, how they are constructed from borehole data, and how they support geological interpretation and engineering analysis.
What Is a Geological Fence Diagram?
A fence diagram is a three-dimensional representation of subsurface geology created by combining multiple intersecting geological cross-sections.
Each cross-section represents a vertical slice through the Earth along a specific line. When several cross-sections are arranged in space so that they intersect each other, they form a structure resembling a fence.
This is where the term fence diagram originates.
Fence diagrams allow geologists to visualize how geological layers extend across an area rather than along a single line. By examining cross-sections from multiple directions, geologists can develop a better understanding of subsurface stratigraphy and geological structure.
Fence diagrams are particularly useful for identifying features that may not be visible in a single cross-section.
The Role of Boreholes in Fence Diagrams
Fence diagrams are typically constructed using data from borehole investigations.
Each borehole provides a vertical record of geological layers encountered during drilling. Borehole logs describe the materials present at different depths, including information about lithology, soil classification, and groundwater observations.
These borehole logs are plotted within cross-sections according to their spatial coordinates.
When multiple cross-sections are created across a site, the boreholes appear in several intersecting sections. This allows geologists to observe how geological layers connect between boreholes in different directions.
The more boreholes available, the more detailed and accurate the fence diagram becomes.
Constructing Fence Diagrams
Creating a fence diagram involves several steps that transform borehole data into a three-dimensional geological interpretation.
Step 1: Collect Borehole Data
The process begins with drilling boreholes across the investigation area.
Each borehole log records the sequence of geological materials encountered during drilling. These logs typically include depth intervals and lithology descriptions.
The borehole locations must also be recorded using spatial coordinates so they can be positioned correctly within the geological model.
Step 2: Create Cross-Sections
Once borehole data has been collected, geologists create geological cross-sections along selected section lines.
Each cross-section aligns a group of boreholes along a line and connects similar geological layers between them.
These cross-sections provide a two-dimensional representation of subsurface geology.
Step 3: Combine Cross-Sections
The next step is to arrange multiple cross-sections so that they intersect across the site.
For example, one cross-section may run north–south while another runs east–west. When these sections intersect, they form a framework resembling a fence.
This arrangement allows geologists to examine how geological layers vary across the site in multiple directions.
Step 4: Interpret Geological Layers
Once the cross-sections are combined into a fence diagram, geologists analyze the continuity of geological layers between them.
This process often reveals geological features that may not be obvious in individual cross-sections.
For example, a sand layer that appears continuous in one cross-section may actually pinch out when viewed from another direction.
Advantages of Fence Diagrams
Fence diagrams provide several advantages for geological interpretation.
Multi-Directional Analysis
A single cross-section provides information along only one line.
Fence diagrams allow geologists to analyze geological layers in multiple directions, revealing patterns that may otherwise remain hidden.
Improved Geological Understanding
By visualizing cross-sections together, geologists can better understand the geometry of geological layers.
This helps identify features such as:
- buried channels
- sediment lenses
- structural deformation
- erosional surfaces
Better Communication
Fence diagrams provide clear visual representations of subsurface geology.
These diagrams help communicate geological interpretations to engineers, project managers, and stakeholders who may not be familiar with borehole logs.
Geological Features Revealed by Fence Diagrams
Fence diagrams often reveal geological features that are difficult to detect using individual borehole logs.
Buried Channels
Ancient river channels filled with sand and gravel can significantly influence groundwater flow and geotechnical conditions.
Fence diagrams can reveal the three-dimensional shape of these channels.
Sediment Lenses
Sediment lenses are localized deposits of materials such as sand or gravel surrounded by different sediments.
These features can influence groundwater movement and soil strength.
Fence diagrams help identify these localized deposits.
Pinch-Outs
Pinch-outs occur when geological layers gradually thin and disappear.
Fence diagrams make it easier to observe these thinning patterns across multiple directions.
Structural Features
In some geological settings, faults or folds may affect the continuity of geological layers.
Fence diagrams can reveal these structural features when cross-sections intersect.
Digital Fence Diagrams
Historically, fence diagrams were drawn manually using geological maps and cross-sections.
Today, most fence diagrams are created using geological modeling software.
These programs allow geologists to import borehole databases and generate digital visualizations of subsurface geology.
Digital fence diagrams offer several advantages:
- interactive visualization
- easier updates when new data is added
- integration with 3D geological models
Geologists can rotate digital fence diagrams and examine the subsurface from different perspectives.
Challenges in Fence Diagram Interpretation
Although fence diagrams are powerful tools, they also present several challenges.
Data Limitations
Fence diagrams rely on borehole data. If boreholes are widely spaced, large portions of the subsurface must be interpreted without direct observations.
This introduces uncertainty into the geological model.
Lithological Variability
Geological materials often change composition across a site.
For example, a sand layer may transition into silty sand or clay. These facies changes can complicate layer correlations.
Software Limitations
Automated modeling software may generate unrealistic correlations if borehole data is inconsistent or poorly structured.
Geologists must review software-generated interpretations carefully.
Best Practices for Creating Fence Diagrams
Several best practices can improve the reliability of fence diagrams.
First, ensure that borehole databases are properly structured before importing them into geological software.
Second, standardize lithology descriptions so that similar materials can be correlated consistently.
Third, use multiple intersecting cross-sections to analyze geological layers from different directions.
Fourth, review geological interpretations carefully to ensure that they are consistent with regional geological conditions.
Finally, communicate uncertainty clearly when interpreting areas with limited borehole data.
Applications of Fence Diagrams
Fence diagrams are used in many geological and engineering applications.
Geotechnical Engineering
Fence diagrams help engineers understand soil stratigraphy beneath construction sites.
This information supports foundation design and infrastructure planning.
Hydrogeology
Hydrogeologists use fence diagrams to visualize aquifers and groundwater flow pathways.
Understanding the geometry of permeable layers is essential for groundwater modeling.
Environmental Investigations
Fence diagrams help environmental scientists understand how contaminants move through soil and groundwater systems.
Mining and Resource Exploration
Mining geologists use fence diagrams to visualize ore deposits and plan exploration drilling programs.
Fence Diagrams and 3D Geological Models
Fence diagrams often serve as an intermediate step in the creation of three-dimensional geological models.
By analyzing cross-sections in multiple directions, geologists can construct surfaces that represent geological boundaries.
These surfaces are then used to build full 3D models of subsurface geology.
Three-dimensional models allow engineers to perform advanced analyses such as groundwater simulations and resource estimations.
Conclusion
Fence diagrams are powerful tools for visualizing subsurface geology and understanding how geological layers extend across a site.
By combining multiple cross-sections into a three-dimensional framework, fence diagrams allow geologists to analyze geological structures from multiple perspectives.
These diagrams reveal important geological features such as buried channels, sediment lenses, and pinch-outs that may not be visible in individual borehole logs.
Modern geological modeling software has made it easier than ever to generate fence diagrams from borehole databases. However, accurate interpretations still depend on careful data preparation and geological expertise.
When used effectively, fence diagrams provide valuable insights into subsurface conditions and support better decision-making in engineering, environmental management, and resource exploration.
Learn more about our Solutions
- GaeaSynergy Platform for Geoscientific Analysis
- WinLoG Borehole and Well Log Data Management
- WinFence Cross-section and Fence Diagram Visualization
Related Articles
- GaeaSynergy: Integrated Geological, Geotechnical, and Environmental Data Management Platform
- Subsurface Visualization: Turning Borehole Data into Clear Geological Insight
- Geological Cross-Sections from Borehole Data: A Complete Engineering Guide
- Common Mistakes When Creating Geological Cross-Sections from Borehole Data
- How Borehole Spacing Affects Geological Cross-Section Accuracy
- Preparing Borehole Databases for Cross-Section Software
- How Lithological Correlation Works Between Boreholes
- Common Data Errors in Borehole Databases and How to Fix Them
- Using Geological Cross-Sections in Geotechnical Engineering
- Borehole Coordinate Systems and Mapping for Geological Modeling
- Depth vs Elevation in Borehole Databases for Geological Modeling
- Interpreting Geological Variability Between Boreholes
- Building Geological Cross-Sections from Borehole Data: A Step-by-Step Workflow
- How Geological Software Interpolates Subsurface Layers Between Boreholes
- Borehole Data Visualization Techniques for Geological Modeling
- Managing Large Borehole Data Sets in Engineering Projects
- Understanding Pinch-Outs and Missing Geological Layers in Subsurface Interpretation