
Introduction
Understanding the three-dimensional structure of subsurface geology is one of the most important challenges in geotechnical engineering, hydrogeology, environmental site assessment, and mining exploration. While borehole logs provide detailed vertical records of geological conditions at specific locations, they do not directly reveal how geological layers extend between boreholes.
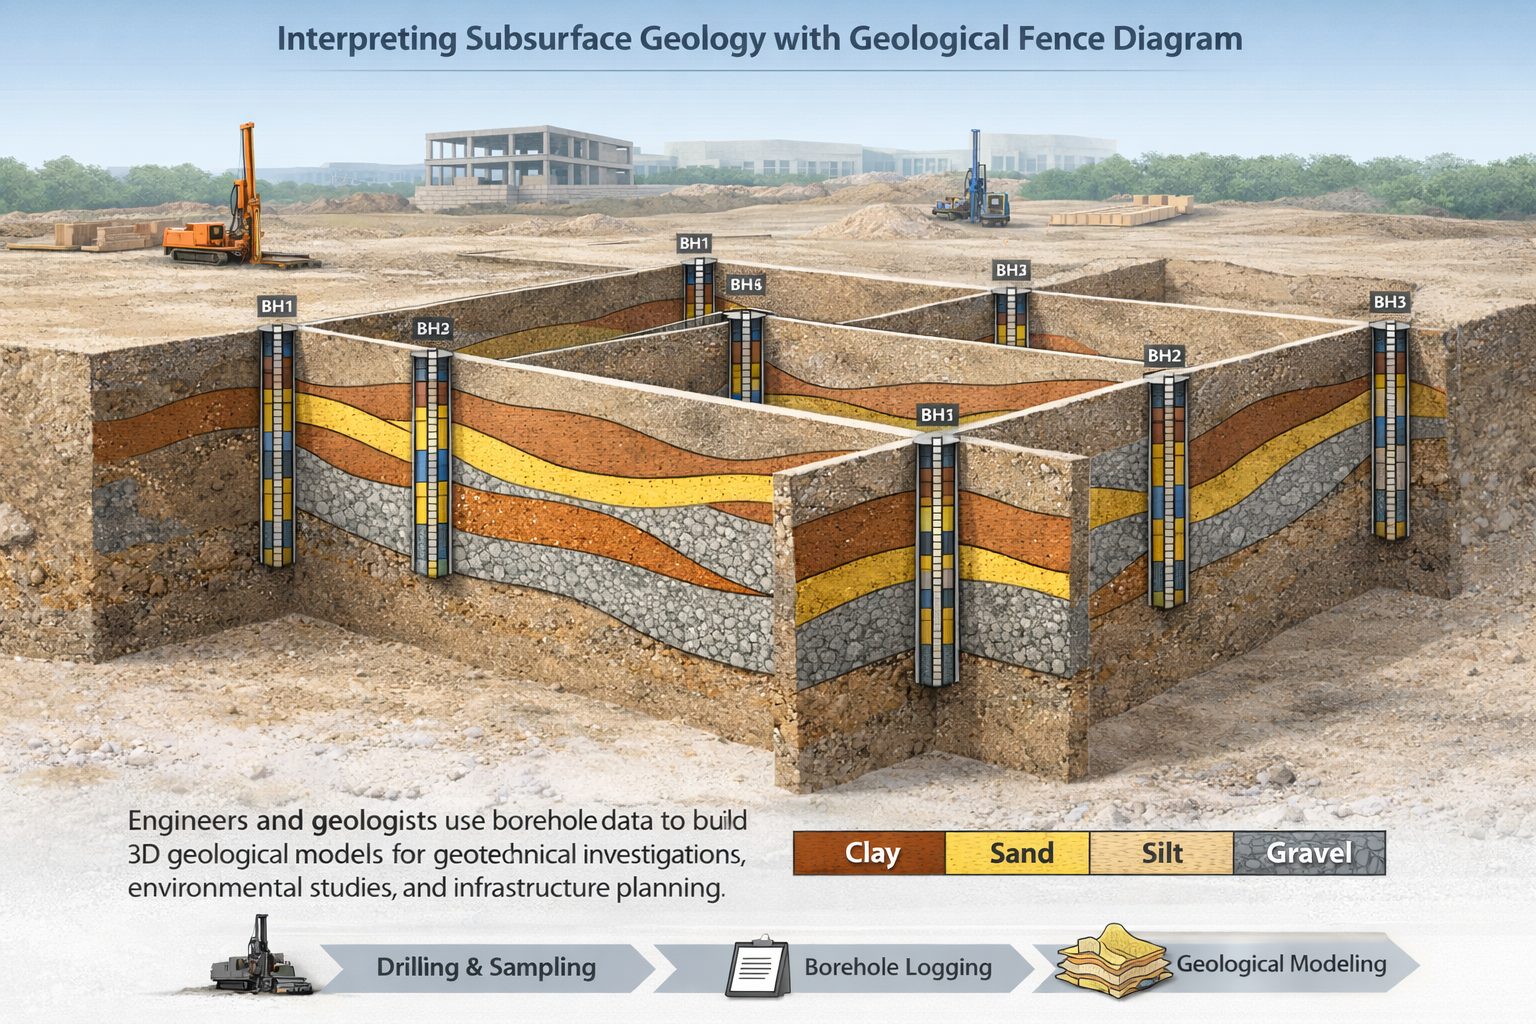
To interpret the subsurface effectively, geologists must integrate information from multiple boreholes and visualize how geological layers connect across a site. One of the most powerful tools for accomplishing this is the geological fence diagram.
Fence diagrams combine multiple geological cross-sections arranged along intersecting lines to create a three-dimensional framework of subsurface geology. By displaying several cross-sections together, fence diagrams help geologists visualize how geological layers vary in different directions and how complex structures extend beneath a site.
With the advancement of digital geological software, fence diagrams have become an essential component of subsurface modeling workflows. Engineers and geologists now use these diagrams to evaluate stratigraphy, identify structural features, analyze groundwater flow paths, and support infrastructure design.
This article explores how fence diagrams are constructed from borehole data, how they support three-dimensional geological interpretation, and the best practices for generating reliable subsurface visualizations.
What Is a Fence Diagram?
A fence diagram is a three-dimensional representation of subsurface geology created by combining multiple geological cross-sections that intersect across an investigation area.
Each cross-section represents a vertical slice through the Earth along a specific line. When several cross-sections are arranged together in space, they form a framework resembling a fence, which is where the name originates.
Fence diagrams allow geologists to visualize how geological layers extend in multiple directions rather than along a single line. This multi-directional perspective provides a clearer understanding of subsurface stratigraphy and geological structure.
Fence diagrams are commonly used in:
- geotechnical engineering
- hydrogeology
- environmental site investigations
- petroleum geology
- mining exploration
In these fields, understanding the spatial relationships between geological units is essential for interpreting subsurface conditions and designing engineering solutions.
Why Borehole Data Alone Is Not Enough
Boreholes provide detailed information about geological conditions at specific locations. Each borehole log records the sequence of materials encountered during drilling, including soil types, sediment layers, rock formations, and groundwater observations.
However, boreholes only sample a small portion of the subsurface. The geological layers between boreholes must be interpreted based on the available data and the geologist’s understanding of regional geology.
When only a single cross-section is created, the interpretation is limited to a two-dimensional slice through the site. While this view can be useful, it may not capture variations that occur in other directions.
For example, a sand layer may appear continuous along one cross-section but may actually pinch out when viewed from another direction. Without multiple cross-sections, these variations can remain hidden.
Fence diagrams solve this problem by combining cross-sections along different orientations. This approach allows geologists to evaluate geological continuity across the entire investigation area.
Constructing Fence Diagrams from Borehole Data
The process of creating a fence diagram begins with a collection of borehole logs from a site investigation. Each borehole contains depth intervals describing the materials encountered during drilling.
To construct the diagram, geologists first select several section lines across the site. These lines typically follow the layout of boreholes or the orientation of geological features.
For each section line, a geological cross-section is created by plotting the boreholes along the line and correlating the geological layers between them.
Once multiple cross-sections have been constructed, they are positioned within a three-dimensional coordinate system according to the spatial coordinates of the boreholes.
The resulting structure resembles a grid of intersecting cross-sections that together form a three-dimensional framework of subsurface geology.
Understanding Lithological Correlation in Fence Diagrams
One of the most important steps in creating fence diagrams is lithological correlation, which involves determining how geological layers connect between boreholes.
Lithological correlation relies on several types of information:
- lithology descriptions
- stratigraphic relationships
- sedimentary structures
- regional geological context
Geologists examine the borehole logs and identify layers that appear to represent the same geological unit. These layers are then connected across the cross-section.
When multiple cross-sections intersect in a fence diagram, geologists must ensure that these correlations remain consistent in all directions.
For example, if a sand layer is correlated between two boreholes in one cross-section, the same layer should also align with cross-sections intersecting those boreholes.
Maintaining consistency across multiple cross-sections is one of the key challenges in constructing fence diagrams.
Pinch-Outs and Layer Termination
Subsurface geology is rarely composed of perfectly continuous layers. Geological units often thin out and disappear between boreholes, a process known as pinch-out.
Pinch-outs occur when sedimentary layers gradually taper until they terminate completely. These features are common in depositional environments such as river channels, deltas, and glacial deposits.
Fence diagrams are particularly useful for identifying pinch-outs because they allow geologists to observe layer continuity in multiple directions.
If a layer appears in one cross-section but disappears in an intersecting cross-section, it may indicate that the layer pinches out within the investigation area.
Correctly identifying pinch-outs is important because misinterpreting them can lead to incorrect geological correlations.
Visualizing Subsurface Geometry
One of the primary advantages of fence diagrams is their ability to illustrate the geometry of geological layers.
By viewing cross-sections together, geologists can observe features such as:
- changes in layer thickness
- inclined sedimentary beds
- erosional surfaces
- buried channels
- fault structures
These features may not be visible when analyzing borehole logs individually.
For example, a buried channel filled with sand may appear as isolated sand layers in individual boreholes. When these boreholes are combined in a fence diagram, the channel geometry may become apparent.
Understanding subsurface geometry is essential for many engineering applications.
Engineering Applications of Fence Diagrams
Fence diagrams are widely used in engineering and environmental projects to evaluate subsurface conditions.
Geotechnical Engineering
In geotechnical investigations, fence diagrams help engineers understand soil stratigraphy beneath construction sites. This information is used to design foundations, assess settlement risks, and evaluate slope stability.
By visualizing soil layers across a site, engineers can identify zones of weak or compressible materials that may affect structural performance.
Hydrogeology
Hydrogeologists use fence diagrams to analyze groundwater flow systems. Geological layers influence how groundwater moves through the subsurface.
Permeable materials such as sand and gravel often form aquifers, while clay layers may act as barriers to groundwater movement.
Fence diagrams help hydrogeologists visualize these relationships and predict groundwater flow paths.
Environmental Investigations
In contaminated sites, fence diagrams are used to understand how pollutants migrate through soil and groundwater.
By mapping geological layers in three dimensions, environmental scientists can identify pathways through which contaminants may spread.
Digital Fence Diagram Software
Historically, fence diagrams were drawn manually using geological maps and cross-sections. This process required significant time and expertise.
Modern geological software now allows fence diagrams to be generated directly from borehole databases.
These programs can automatically:
- align boreholes along section lines
- correlate lithological layers
- generate cross-sections
- combine multiple sections into fence diagrams
Digital visualization tools also allow users to rotate, zoom, and modify interpretations interactively.
Some software platforms extend fence diagrams into fully three-dimensional geological models.
Challenges in Fence Diagram Interpretation
Although fence diagrams are powerful tools, they also present several challenges.
One of the most significant challenges is data density. If boreholes are widely spaced, large areas of the subsurface must be interpreted without direct observations.
This can introduce uncertainty into the model.
Another challenge involves inconsistent borehole logs. If lithology descriptions vary between boreholes, it may be difficult to determine whether layers represent the same geological unit.
Data preparation and standardization are therefore essential before constructing fence diagrams.
Best Practices for Creating Reliable Fence Diagrams
Producing reliable fence diagrams requires careful attention to data quality and geological interpretation.
Some recommended practices include:
- verifying borehole coordinates and elevations
- standardizing lithology descriptions
- ensuring depth intervals are continuous
- considering regional geological context
- reviewing interpretations across intersecting sections
Using multiple cross-sections that intersect across the site can help reduce interpretation errors.
Regular review by experienced geologists can also improve the reliability of fence diagram interpretations.
The Future of 3D Geological Visualization
Advances in digital technology are transforming how geologists visualize subsurface conditions.
Three-dimensional geological modeling software now allows fence diagrams to be integrated into complex subsurface models that incorporate borehole data, geophysical surveys, and geological maps.
These models can simulate groundwater flow, predict contaminant migration, and evaluate geotechnical risks.
As computing power and data integration technologies continue to improve, subsurface visualization tools will become even more sophisticated.
However, even with advanced modeling software, fence diagrams will remain an essential tool for understanding the spatial relationships between geological layers.
Conclusion
Fence diagrams play a critical role in visualizing the three-dimensional structure of subsurface geology. By combining multiple geological cross-sections, these diagrams allow geologists and engineers to interpret how geological layers extend across a site.
Constructing accurate fence diagrams requires careful correlation of borehole data, recognition of geological features such as pinch-outs, and an understanding of regional stratigraphy.
Modern geological software has made it easier to generate fence diagrams and integrate them into three-dimensional subsurface models. These tools support a wide range of applications in geotechnical engineering, hydrogeology, environmental science, and resource exploration.
When combined with well-structured borehole databases and sound geological interpretation, fence diagrams provide powerful insights into the hidden structure of the subsurface.
Learn more about our Solutions
- GaeaSynergy Platform for Geoscientific Analysis
- WinLoG Borehole and Well Log Data Management
- WinFence Cross-section and Fence Diagram Visualization
Related Articles
- Geological Cross-Sections from Borehole Data: A Complete Engineering Guide
- Geological Modeling Software and Tools: Digital Platforms for Subsurface Interpretation
- Common Mistakes When Creating Geological Cross-Sections from Borehole Data
- How Borehole Spacing Affects Geological Cross-Section Accuracy
- Preparing Borehole Databases for Cross-Section Software
- How Lithological Correlation Works Between Boreholes
- Understanding Fence Diagrams in Geological Modeling
- Common Data Errors in Borehole Databases and How to Fix Them
- Using Geological Cross-Sections in Geotechnical Engineering
- Borehole Coordinate Systems and Mapping for Geological Modeling
- Depth vs Elevation in Borehole Databases for Geological Modeling
- Interpreting Geological Variability Between Boreholes
- Building Geological Cross-Sections from Borehole Data: A Step-by-Step Workflow
- How Geological Software Interpolates Subsurface Layers Between Boreholes
- Borehole Data Visualization Techniques for Geological Modeling
- Managing Large Borehole Data Sets in Engineering Projects
- Understanding Pinch-Outs and Missing Geological Layers in Subsurface Interpretation
- Digital Workflows for Geotechnical Data: Managing Borehole Information from Field to Model
- Best Practices for Borehole Logging and Interpretation in Geological and Geotechnical Investigations
- Subsurface Modeling for Engineering Projects: Interpreting Geological Conditions Beneath Infrastructure
- Borehole Databases and Geological Data Management: A Complete Guide for Engineers and Geologists