
Asphalt
Absolute Viscosity
Binder viscosity calculations and comparison graphs for an asphalt absolute-viscosity test.



Browse representative test outputs for asphalt, concrete, rock, soil and aggregates.
Each example connects laboratory measurements with calculated results, technical graphs and a standardized project report. Filter by material group or search for a specific test.
The gallery reflects the material-specific workflows used to enter, calculate, review and communicate geotechnical laboratory results.
Binder content, viscosity, density, specific gravity and Marshall stability.
Compressive, flexural and splitting-tensile strength reports.
Water content, point-load, unconfined and triaxial strength.
Classification, compaction, strength, permeability and durability.
Choose a material group first, then search by test name, calculation, property or output. Select any image to inspect the full-size report.
Showing 31 examples
Binder viscosity calculations and comparison graphs for an asphalt absolute-viscosity test.

Timed-flow observations, calculated kinematic viscosity and result graphs.

Specimen masses, extracted materials and calculated bitumen content.

Specimen mass, density, water absorption and calculated bulk specific gravity.

Maximum specific-gravity and density calculations with a graphical result summary.

Marshall stability, flow, specimen measurements and load-deformation results.

Field wet-density readings, corrected density and relative-compaction reporting.

Concrete specimen break records and calculated compressive-strength results.

Beam-test observations and calculated concrete flexural strength.

Cylinder measurements, failure load and calculated splitting-tensile strength.

Grout specimen dimensions, break results and calculated compressive strength.

Mortar specimen test records and calculated compressive-strength summary.

Rock specimen dimensions, failure loads and corrected point-load strength index.

Stress-strain plots, confining-pressure results and interpreted strength information.

Axial stress-strain response and peak unconfined compressive strength.

Wet and dry specimen masses with calculated rock water content.
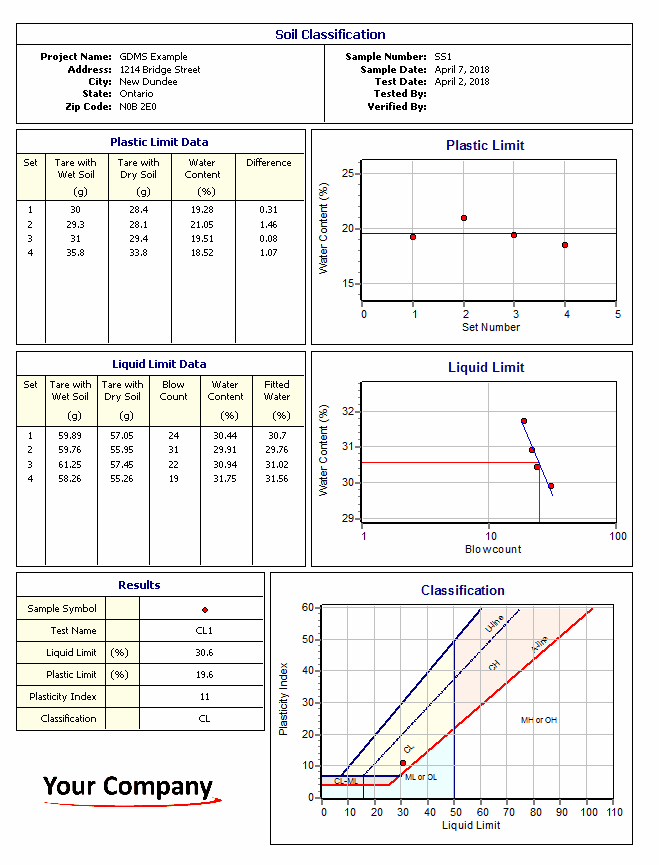
Penetration-load readings and calculated CBR values in a detailed result sheet.

Moisture-density results, compaction curve, optimum moisture and maximum dry density.

CBR calculations with load-penetration and summary curves.

Load and deformation data with time-settlement and consolidation plots.

Flow observations and calculated hydraulic conductivity under constant head.

Head-time observations and calculated hydraulic conductivity under falling head.

Shear stress, displacement and interpreted soil-strength parameters.

Aggregate mass-loss calculations and abrasion-resistance result.

Field density, moisture and relative-compaction measurements.

Specimen measurements and calculated shrinkage limit and shrinkage ratio.

Pressure and expansion measurements with calculated pavement-design R-value.

Confining-pressure and loading data with stress-strain results.

Mass and temperature observations with calculated specific gravity of soil solids.

Sieve and hydrometer results presented as a particle-size distribution curve.
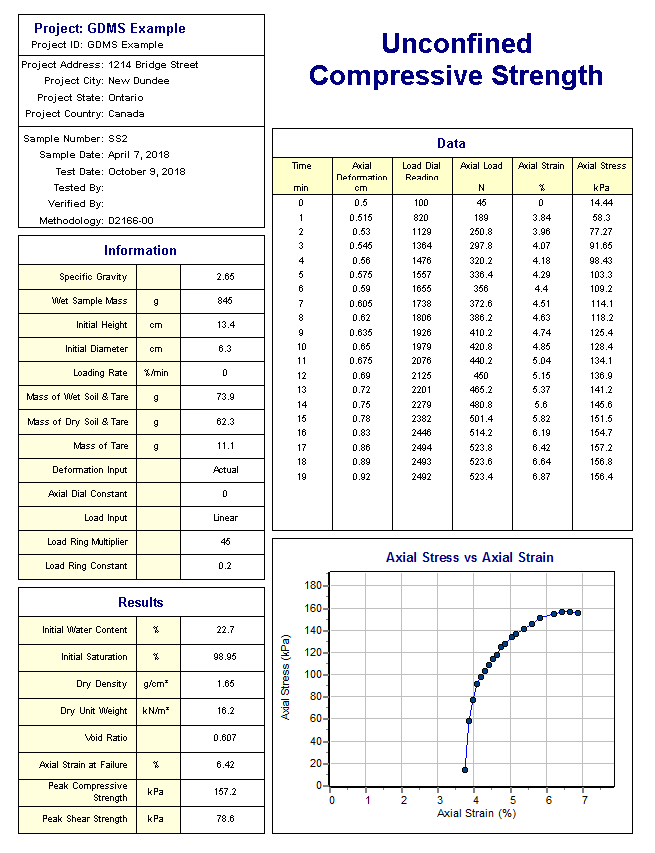
Stress-strain data and calculated peak strength for a cohesive soil specimen.
The layout varies by test, but every example demonstrates part of a consistent laboratory-data lifecycle.
Connect the project, sample, material, specimen and test procedure.
Record masses, dimensions, loads, readings and observations.
Produce derived values, classifications, tables and engineering curves.
Check the result and retain a standardized output with its source data.
Compare example outputs with the supported test workflows, software capabilities and your laboratory requirements.
Search the complete workflow reference by material, purpose and typical output.
Review supported test typesExplore laboratory records, calculations, quality control and standardized reporting.
Explore GDMS featuresLearn how structured test data improves retrieval, consistency and reporting.
Read the laboratory guideUse these reports to compare GDMS outputs with your materials, methods, quality controls and deliverables.

GAEA Technologies develops and distributes geoscience and engineering solutions worldwide. Our solutions have been used for over 30 years by companies and organizations around the world.
© 2026 GAEA Technologies. All Rights Reserved.