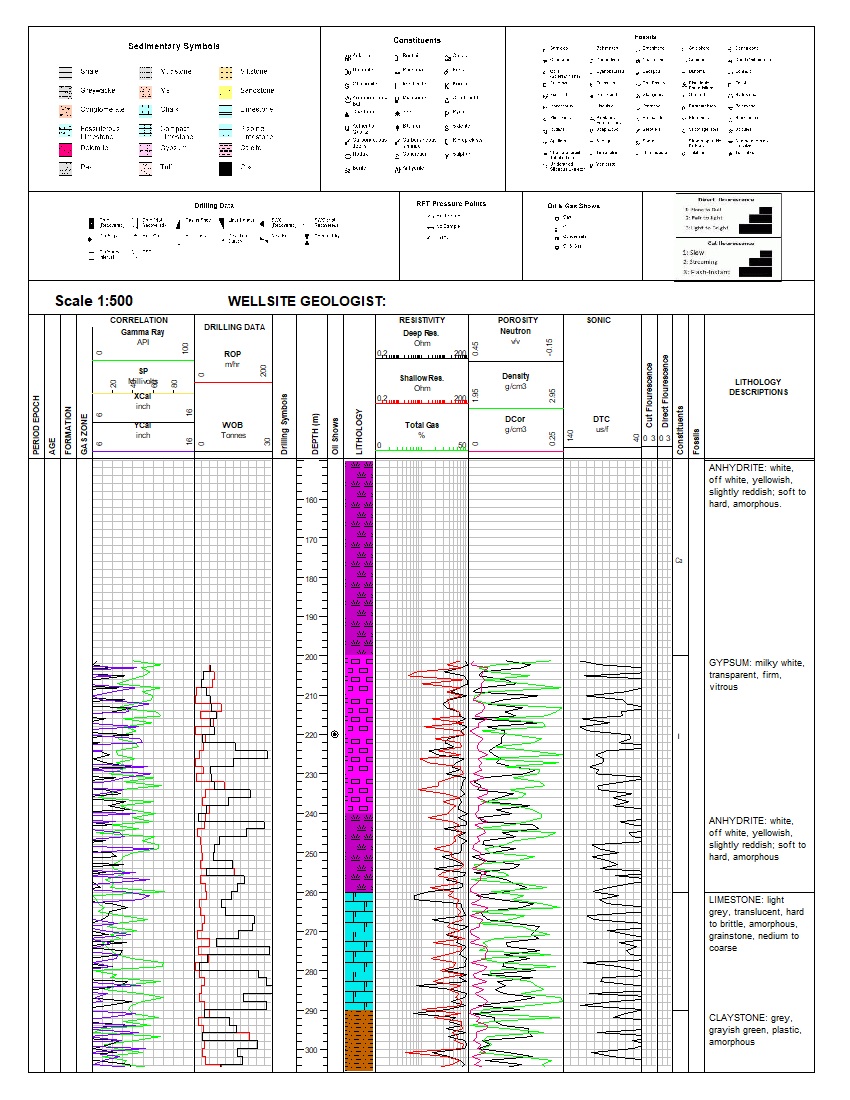
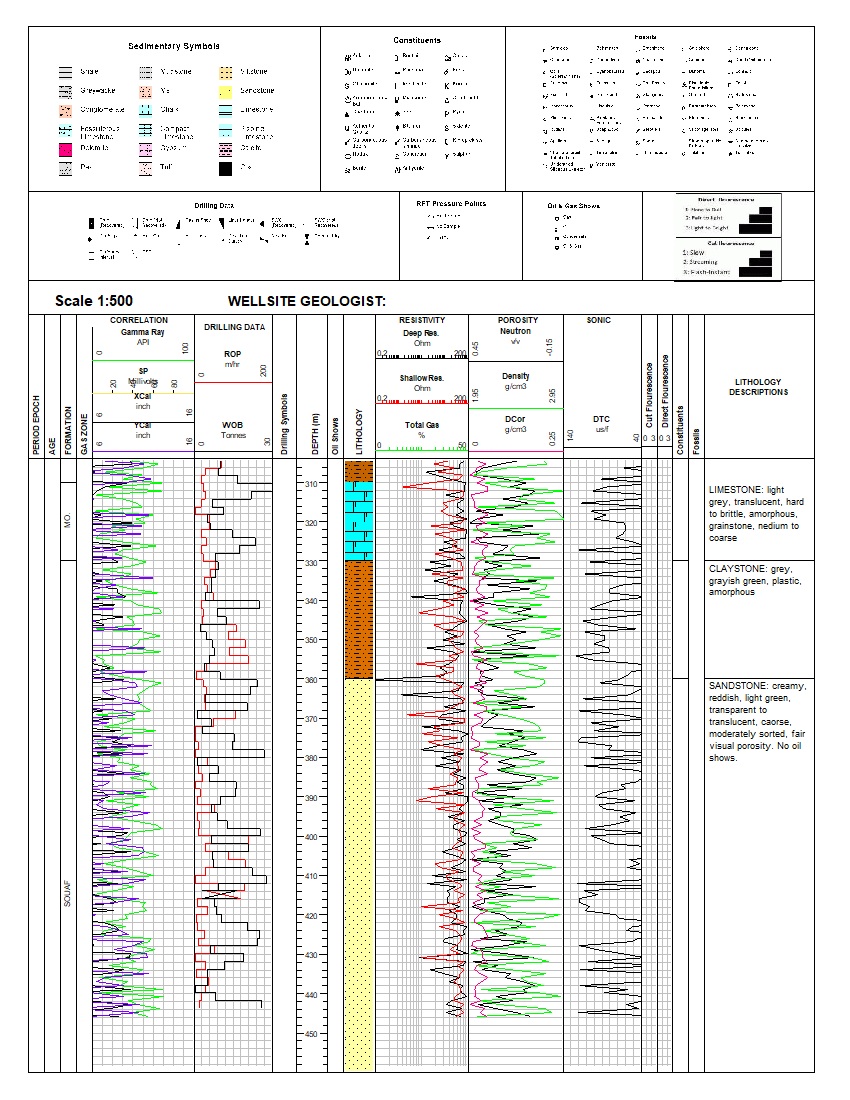
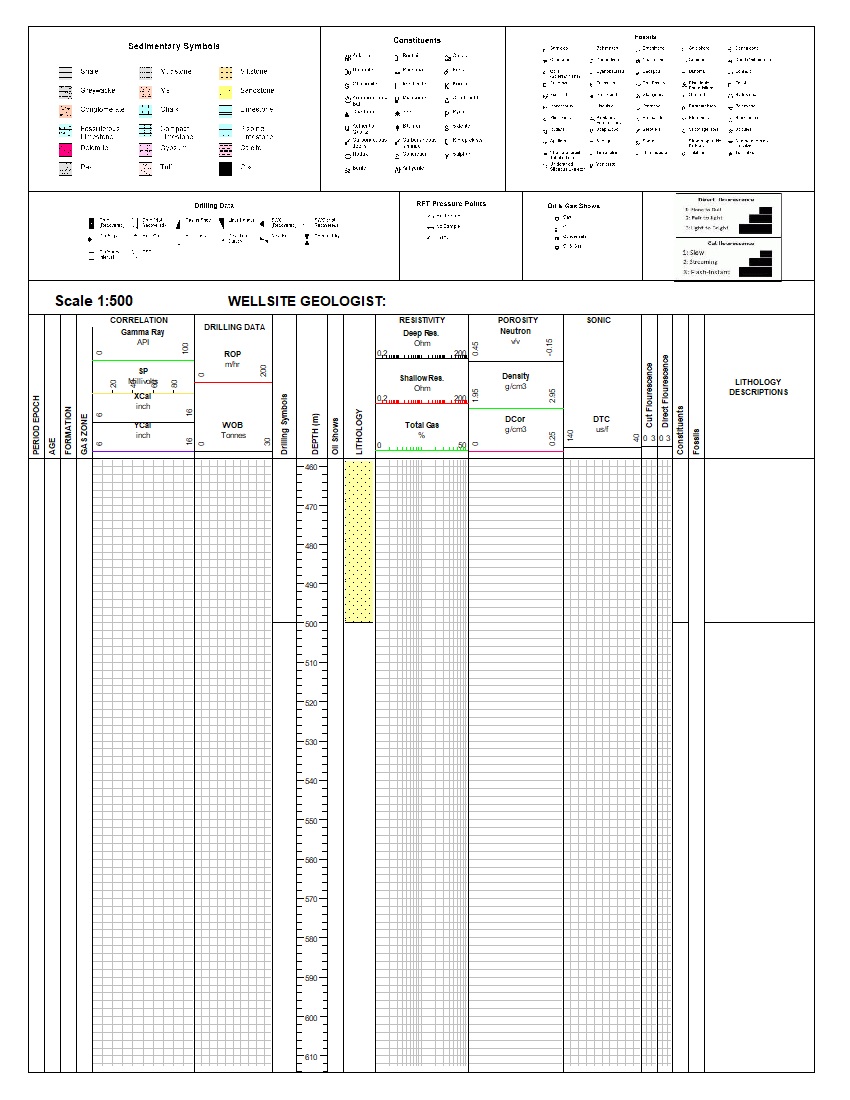
This example demonstrates a 500 ft petroleum borehole that brings multiple disciplines into one depth-aligned presentation. The layout combines correlation curves, drilling data, lithology, oil shows, resistivity, porosity and sonic measurements with formation, gas-zone and fossil tracks.
The XML record contains 13 continuous geophysical datasets, eight lithology intervals, three formation tops, four fossil observations and one oil show. Automated validation passed with no errors or warnings; the report also records 44% completeness, Fair quality and 68% confidence.
The validation engine found zero errors and zero warnings, so the rule-checking status is Passed. This means no configured rule was violated; it does not mean every optional dataset is populated.
The same report records 44% completeness, Fair data quality and a 68% confidence score. Showing these measures together demonstrates the distinction between passing validation rules and having a fully populated record.
Review the finished three-sheet log and validation report, or load the supplied XML log and template into WinLoG.
Demonstrates a consolidated view of drilling response, gas shows, lithology, formations and descriptive observations.
Shows correlation of resistivity, porosity and sonic curves with total gas and geological control.
Provides a reusable model for dense multi-track petroleum layouts, legends, formation columns and validation reporting.
WinLoG templates can be customized for company standards, curve suites, drilling symbols, formation schemes, lithology libraries, legends and organization-specific validation requirements.
Contact GAEA Technologies
GAEA Technologies develops and distributes geoscience and engineering solutions worldwide. Our solutions have been used for over 30 years by companies and organizations around the world.
© 2026 - All Rights Reserved