WinLoG Oil Sands Lithology Cross-plot Example

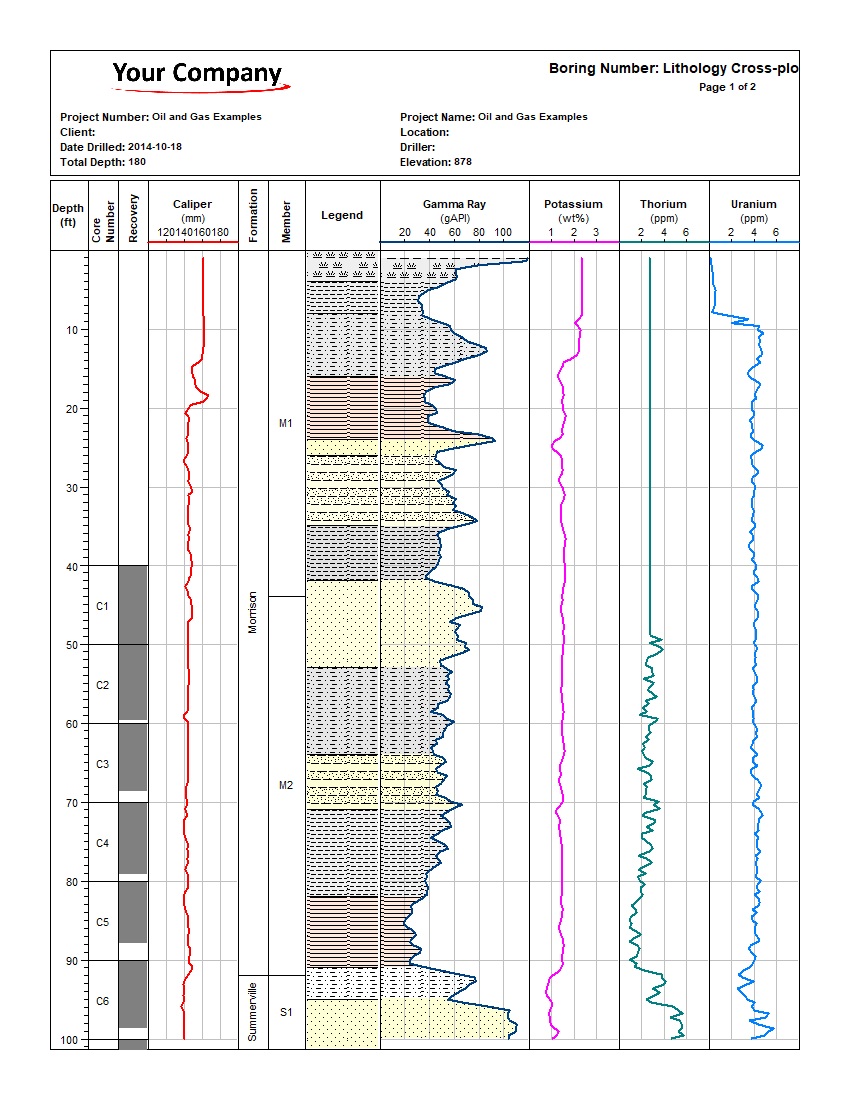
Oil sands lithology cross-plot log, sheet 1 View Full Log
Lithology Cross-plot
2-page log Validation Passed
OIL SANDS SPECTRAL GAMMA-RAY EXAMPLE

WinLoG Oil Sands Lithology Cross-plot Example

Integrated lithology, core recovery, caliper and spectral gamma-ray interpretation in a two-sheet borehole log.

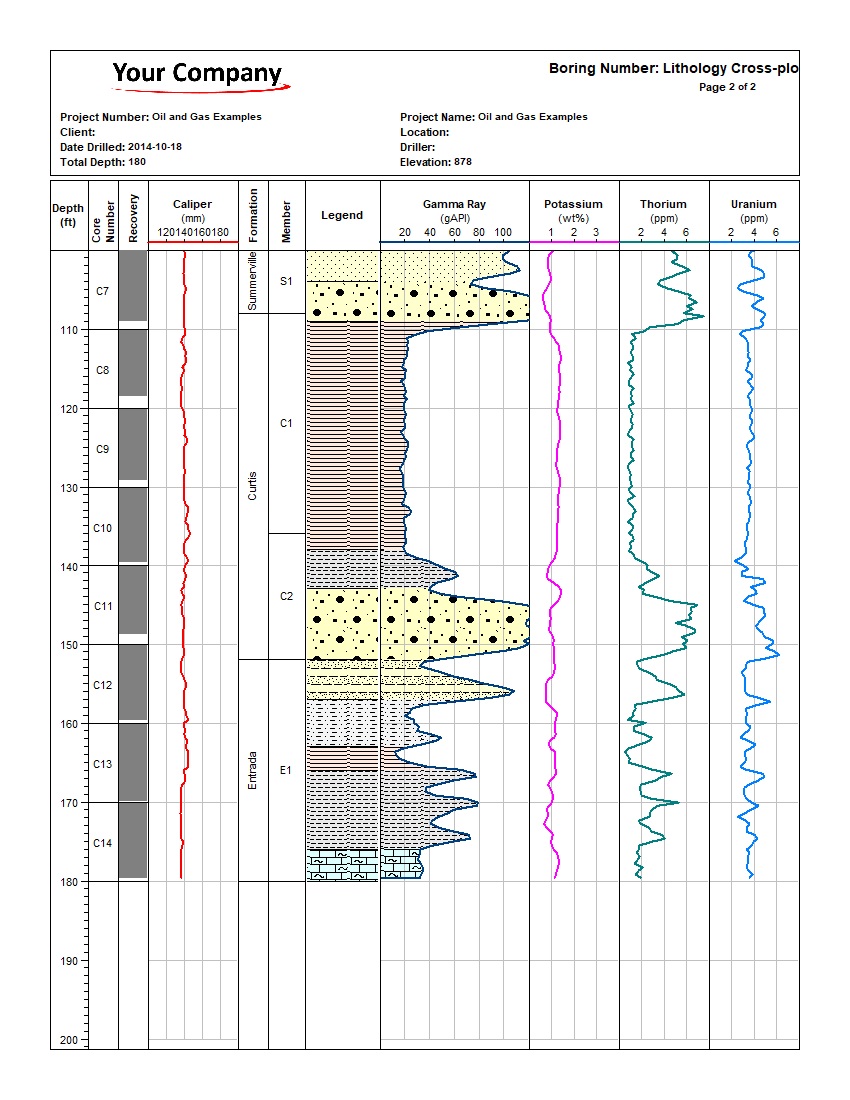
This example demonstrates a 180 ft oil-sands borehole with 23 lithology intervals, four formations, six members and 14 core-recovery intervals. The lithology cross-plot places total gamma-ray response beside standardized sedimentary symbols so curve character and stratigraphy can be reviewed together.

Separate potassium, thorium and uranium profiles provide a spectral breakdown of the gamma-ray response, while caliper and recovery data add borehole-condition and sampling context. The validation completed with 100% completeness, 85% confidence, and no errors or warnings.

Oil SandsLithology Cross-plotSpectral Gamma RayCore RecoveryCaliperValidation PassedXML Template

Download Complete Example Back to Example Library

Capabilities Demonstrated

What This Lithology Cross-plot Example Shows

Lithology

  • 23 depth-based intervals
  • Standard sedimentary symbols
  • Gamma-ray curve fill
  • Depth and elevation reference
  • Formation/member correlation

Spectral Curves

  • Gamma Ray (gAPI)
  • Potassium (wt%)
  • Thorium (ppm)
  • Uranium (ppm)
  • Depth-aligned profiles

Core Sampling

  • Samples C1 through C14
  • Ten-foot core intervals
  • 78–99% recovery range
  • Recovery bars by depth
  • Core and geology comparison

Validation

  • Validation passed
  • 100% completeness
  • 85% confidence
  • No errors or warnings
  • Two-page output verified

Integrated Stratigraphic and Spectral Interpretation

The formation column divides the borehole into Morrison (0–92 ft), Summerville (92–108 ft), Curtis (108–152 ft) and Entrada (152–180 ft). Six member intervals—M1, M2, S1, C1, C2 and E1—provide a finer stratigraphic framework.

Curve tracks use practical display ranges: caliper 120–180 mm, gamma ray 20–100 gAPI, potassium 1–3 wt%, thorium 2–6 ppm and uranium 2–6 ppm. This side-by-side layout makes it easy to compare lithologic changes with total and component gamma-ray responses.

Example Data

Formations, Members and Curves

Stratigraphic Framework

  • Morrison: 0–92 ft; members M1 and M2
  • Summerville: 92–108 ft; member S1
  • Curtis: 108–152 ft; members C1 and C2
  • Entrada: 152–180 ft; member E1
  • Four formations and six members total

Displayed Measurements

  • Caliper: borehole diameter in millimetres
  • Gamma Ray: total response in gAPI
  • Potassium: weight percent
  • Thorium and Uranium: parts per million
  • Core recovery: percent by sample interval
Log Preview

Review Both Sheets of the Borehole Log

Lithology cross-plot from 0 to 100 ft View Sheet 1
Sheet 1 — 0 to 100 ft
Lithology cross-plot from 100 to 180 ft View Sheet 2
Sheet 2 — 100 to 180 ft
Downloads

Download the Complete Example

Use the finished log and report for review, or load the XML log and template into WinLoG.