WinLoG Elemental Abundances Example

Elemental abundances drillhole log with geochemical curves, recovery and lithology View Full Log
Elemental Abundances Drillhole Log
1-page log Validation Passed
MINING GEOCHEMISTRY EXAMPLE

WinLoG Elemental Abundances Example

Depth-aligned elemental, mineralogical and geological data in a validated mineral-exploration drillhole log.

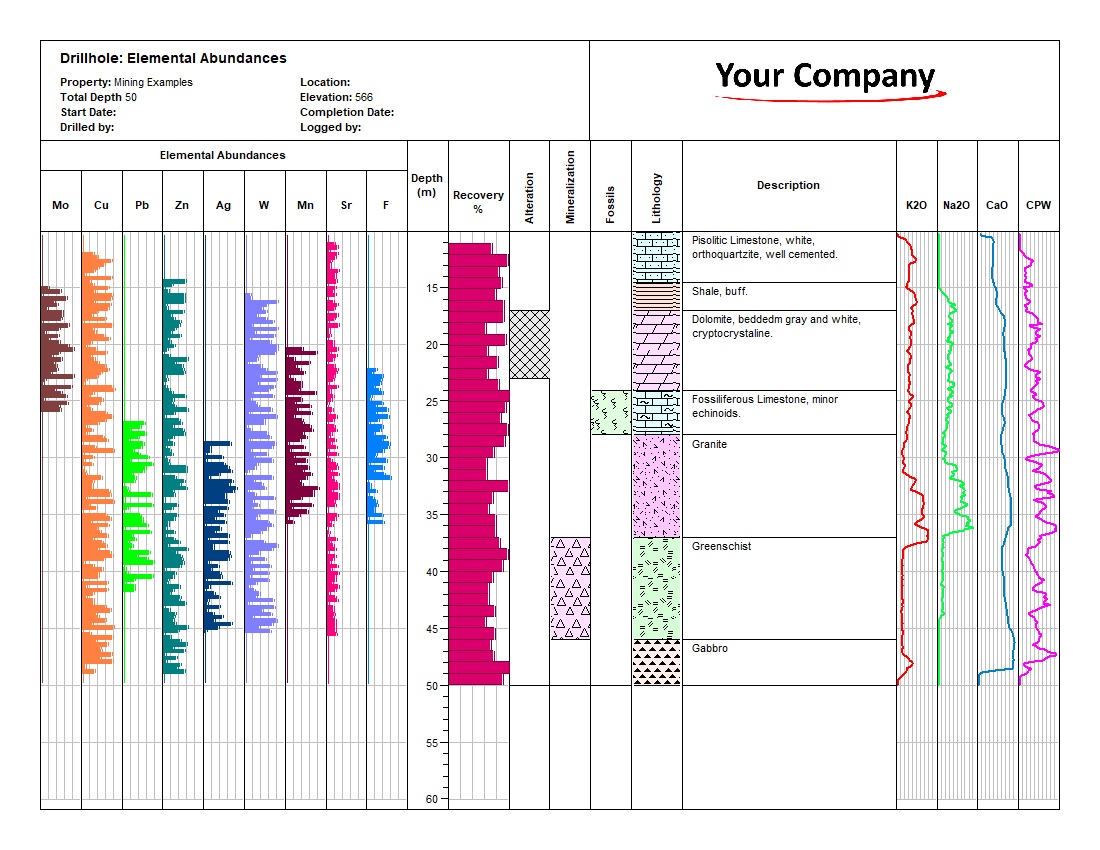
This example presents a 50 m mineral-exploration drillhole using fourteen coordinated graph datasets. It displays the elemental abundance profiles for Mo, Cu, Pb, Zn, Ag, W, Mn, Sr and F, together with recovery and the K2O, Na2O, CaO and CPW curves.

Alteration, mineralization, fossils, lithology symbols and detailed geological descriptions share the same measured-depth scale, allowing geochemical changes to be compared directly with interpreted rock units. Automated validation completed with 100% completeness, 85% confidence, and no errors or warnings.

14 Graph DatasetsElemental AbundancesRecoveryLithologyAlterationMineralizationFossilsValidation PassedXML Template

Download Complete Example Back to Example Library

Capabilities Demonstrated

What This Elemental Abundances Example Shows

Element Profiles

  • Molybdenum (Mo)
  • Copper (Cu), lead (Pb) and zinc (Zn)
  • Silver (Ag) and tungsten (W)
  • Manganese (Mn) and strontium (Sr)
  • Fluorine (F)

Geochemistry

  • K2O profile
  • Na2O profile
  • CaO profile
  • CPW curve
  • Depth-aligned curve comparison

Geological Context

  • Seven lithologic intervals
  • Alteration track
  • Mineralization track
  • Fossil occurrence track
  • Detailed interval descriptions

Validation

  • Validation passed
  • 100% completeness
  • 85% confidence
  • No errors or warnings
  • Quality rated Good

Geochemical Curves Beside Interpreted Geology

The example places high-density elemental and mineralogical curves beside recovery, alteration, mineralization, fossils and lithology. This makes changes in geochemical response immediately comparable with geological boundaries and descriptive observations.

The log spans depths from 10 to 50 m and includes pisolitic limestone, shale, dolomite, fossiliferous limestone, granite, greenschist and gabbro. Consistent depth alignment supports rapid visual correlation and review across all datasets.

Example Data

Elemental, Mineralogical and Geological Information

Drillhole and Graph Data

  • Project: Mining Examples
  • Logged interval: 10 to 50 m
  • Elevation: 566 m
  • Fourteen graph datasets
  • Recovery displayed as a percentage profile

Displayed Geological Data

  • Seven sedimentary, igneous and metamorphic intervals
  • Standard lithology patterns and descriptions
  • Alteration from 17 to 23 m
  • Fossils from 24 to 28 m
  • Mineralization from 37 to 46 m
Log Preview

Review the Elemental Abundances Log

Full elemental abundances drillhole log View Full Log
Elemental Abundances - Complete Log
Downloads

Download the Complete Example

Review the finished log and validation report, or load the XML log and template into WinLoG.