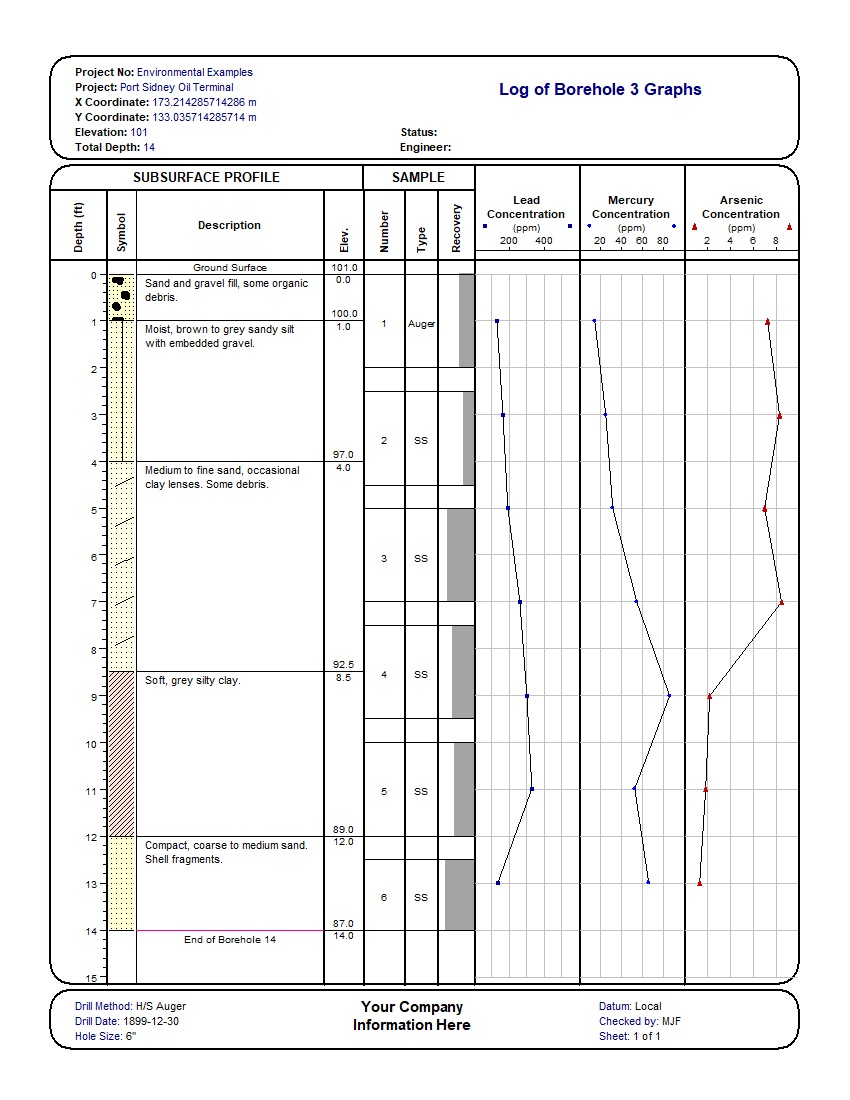
This example shows how WinLoG combines an environmental borehole record with three continuous concentration profiles. 3 Graphs presents lead, mercury, and arsenic results beside lithology, elevation, sample intervals, sample type, and recovery, allowing contaminant trends to be compared directly with subsurface conditions.
The 14 ft borehole includes fill, sandy silt, sand, and silty clay with six environmental samples. Automated validation passes the example with 100% completeness, 85% confidence, and no errors or warnings.
This record demonstrates how lead, mercury, and arsenic profiles can be interpreted beside lithology, sample intervals, recovery, and elevation. All three graphs use the same depth positions while retaining independent concentration scales, making changes and correlations between contaminants and subsurface materials easy to review.
The supplied validation report records Passed status, 100% completeness, Good quality, an 85% confidence score, and zero errors and zero warnings.
Download the example files individually. The XML template and log can be imported into WinLoG Version 6 and customized for company-specific environmental workflows.
Demonstrates an integrated workflow for environmental site investigations with multiple depth-dependent contaminant datasets.
Shows how samples, recovery, lithology, and multiple laboratory or field-result profiles share a common depth-based presentation.
Provides an integrated record for reviewing graph coverage, concentration trends, sample support, lithology, and completeness together.
WinLoG templates can be customized to match company standards, project requirements, and agency formats. Graph titles, units, scales, line styles, point symbols, sampling, lithology, and validation rules can be tailored to project requirements.
Contact GAEA Technologies
GAEA Technologies develops and distributes geoscience and engineering solutions worldwide. Our solutions have been used for over 30 years by companies and organizations around the world.
© 2026 - All Rights Reserved/span>