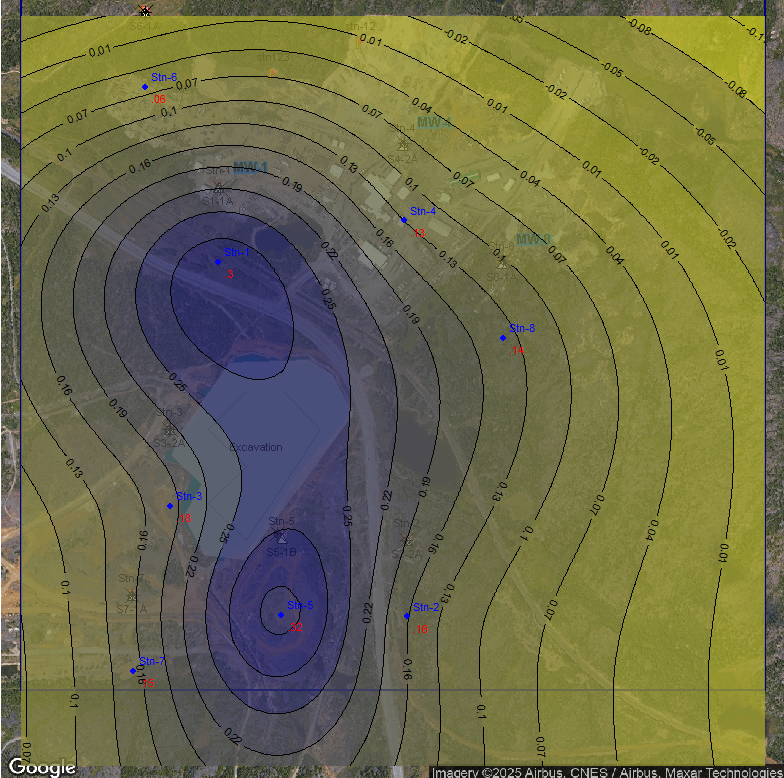
A contoured environmental surface used to communicate spatial trends in groundwater elevations or analytical concentrations across a site.
Connect the examples to product capabilities, workflow guidance and purchasing information.
Review scheduling, samples, laboratory EDDs, QA/QC, reporting and spatial integration.
Explore EDMS featuresSee how EDMS connects environmental field, laboratory and office workflows.
View the product pageFollow the four-stage process from planning through final reporting.
Read the workflow guideReview principles for structuring, validating and reporting environmental information.
Read the complete guideLearn how structured field collection reduces transcription and handoff errors.
Explore field workflowsOrganize field and laboratory results, verify them against project requirements and present the findings in formats suited to technical review.

GAEA Technologies develops and distributes geoscience and engineering solutions worldwide. Our solutions have been used for over 30 years by companies and organizations around the world.
© 2026 GAEA Technologies. All Rights Reserved.