EDMS Example Library

EDMS Example Library

Environmental Reports, Maps and Visualizations

Browse examples showing how EDMS organizes environmental samples and analytical results, presents groundwater monitoring information and connects structured data with project reporting, contour maps and 3D views.

5Examples
3Reports
2Spatial Views

Browse All EDMS Examples

Filter the collection by output type or environmental application.

Environmental Project Reporting View EDMS example  View Full Size
Charts and Tables · Project Reporting

Environmental Project Reporting View

A consolidated EDMS project view combining environmental results in a presentation-ready layout for technical review and reporting.

Project-level summaryTables and graphsCustom presentation
Sample and Analytical Results Summary EDMS example  View Full Size
Charts and Tables · Laboratory and QA/QC

Sample and Analytical Results Summary

A structured sample-results view for reviewing field information, analytical values, qualifiers and criteria within the EDMS workflow.

Sample recordsAnalytical resultsCriteria review
Monitoring Well and Groundwater Summary EDMS example  View Full Size
Charts and Tables · Groundwater Monitoring

Monitoring Well and Groundwater Summary

An EDMS summary connecting monitoring-well locations and groundwater information with environmental samples and analytical results.

Monitoring wellsGroundwater recordsSample relationships
3D Environmental Data Visualization EDMS example  View Full Size
Spatial Visualization · Environmental Interpretation

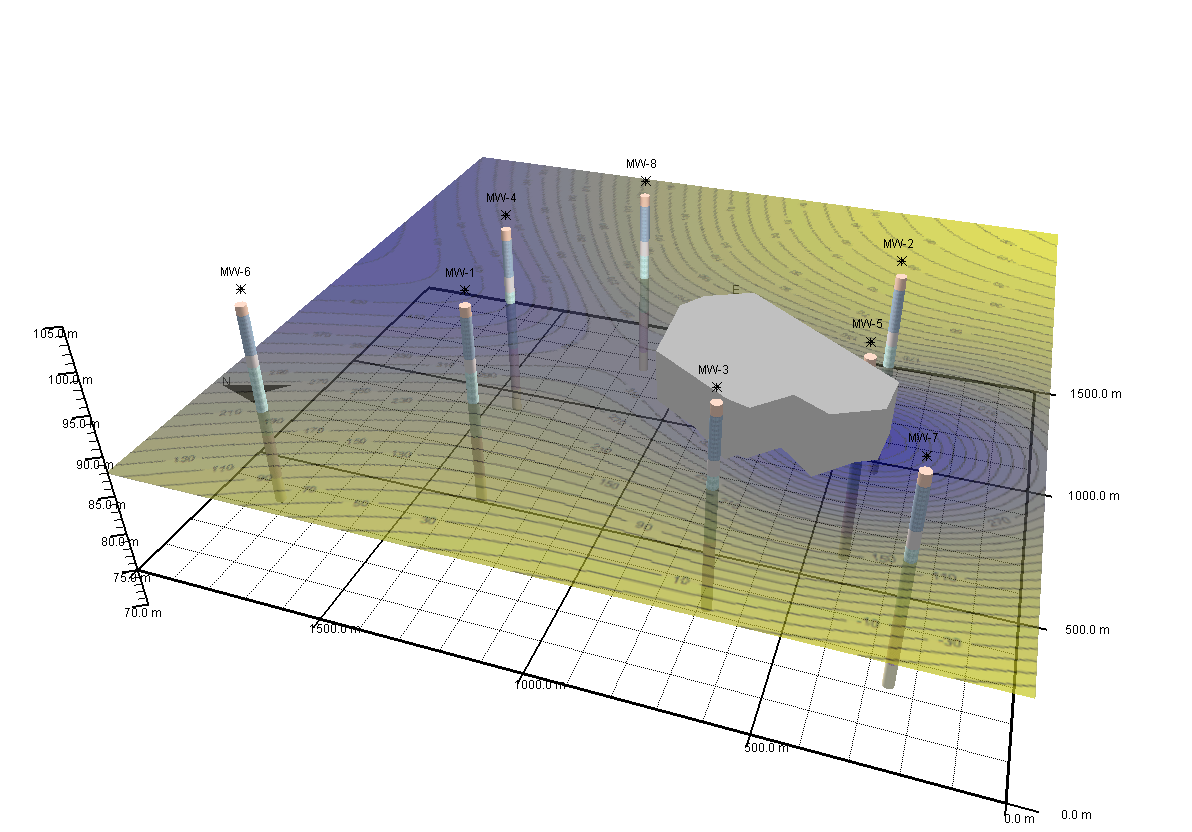
3D Environmental Data Visualization

A three-dimensional project view showing environmental data in spatial context for communication and interpretation.

3D project contextSample locationsConcentration display
Groundwater and Contaminant Contour Map EDMS example  View Full Size
Spatial Visualization · Groundwater and Contaminants

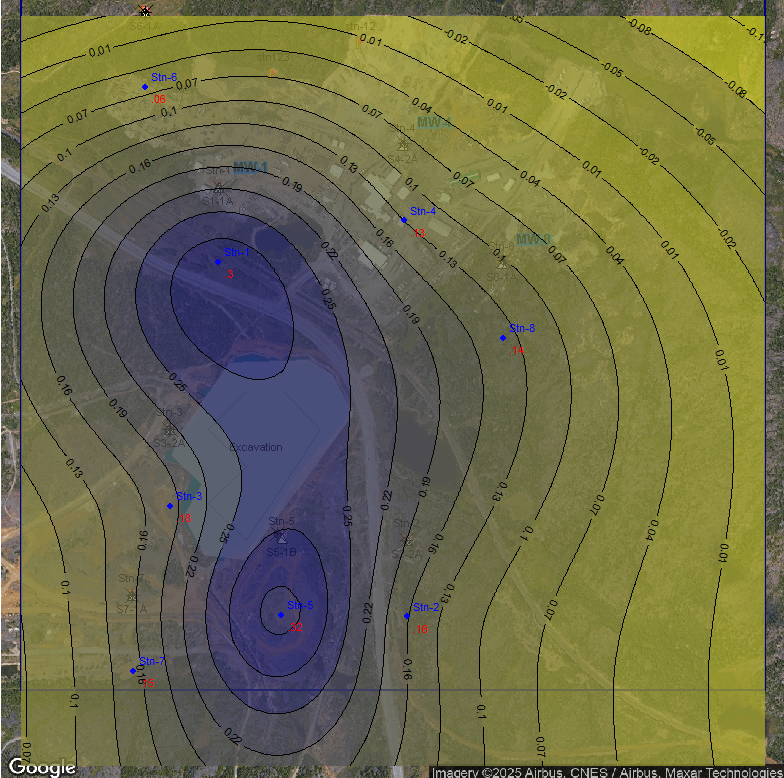
Groundwater and Contaminant Contour Map

A contoured environmental surface used to communicate spatial trends in groundwater elevations or analytical concentrations across a site.

Gridding and contouringSpatial trendsGroundwater or concentration data

How EDMS Results Become Project Deliverables

The example outputs are different views of the same structured environmental workflow.

1

Collect

Record planned samples, field observations, stations, wells and supporting documentation.

2

Integrate

Import laboratory EDDs and connect analytical results with their samples and project locations.

3

Review

Check units, qualifiers, detection limits, QA/QC records and regulatory criteria.

4

Present

Use reports, maps, contours and 3D views to communicate the results.

Related EDMS Resources

Connect the examples to product capabilities, workflow guidance and purchasing information.

EDMS Features

Review scheduling, samples, laboratory EDDs, QA/QC, reporting and spatial integration.

Explore EDMS features

EDMS Overview

See how EDMS connects environmental field, laboratory and office workflows.

View the product page

Auditable Workflow

Follow the four-stage process from planning through final reporting.

Read the workflow guide

Environmental Data Management

Review principles for structuring, validating and reporting environmental information.

Read the complete guide

Field Data Collection

Learn how structured field collection reduces transcription and handoff errors.

Explore field workflows

EDMS Purchase

Review the available EDMS licensing and purchasing options.

Purchase EDMS

Turn Environmental Data into Clear Project Information

Organize field and laboratory results, verify them against project requirements and present the findings in formats suited to technical review.