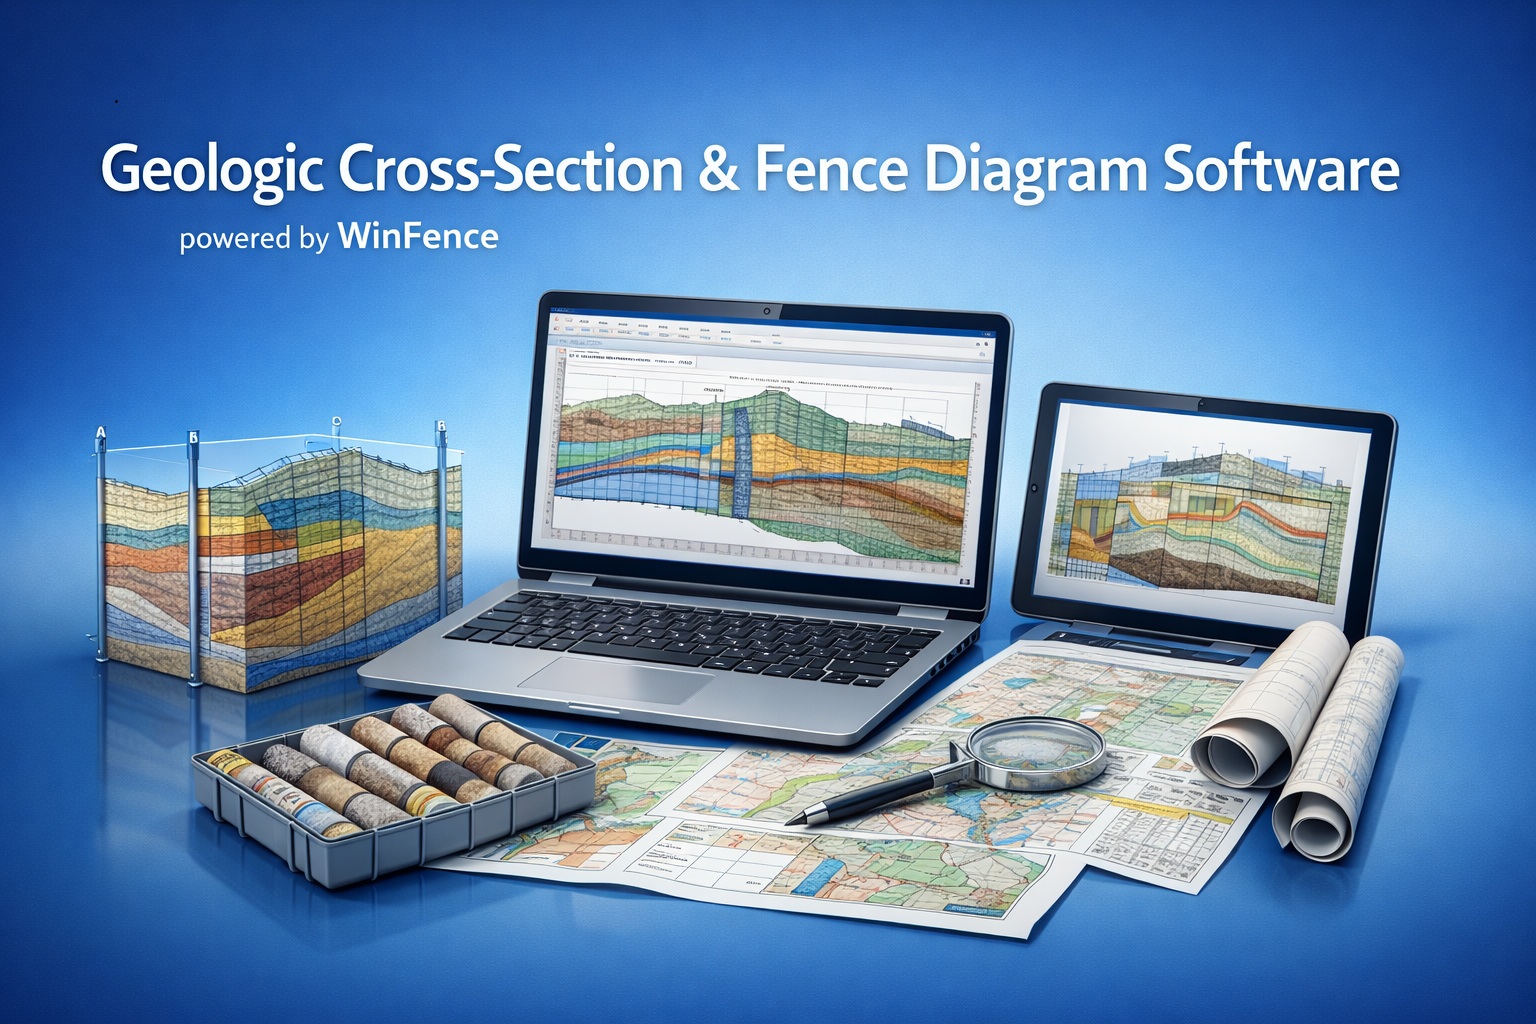
WinFence Features

Build Geological Cross-Sections with Speed and Interpretive Control

Turn connected borehole and well data into detailed 2D cross-sections, then combine sections in 3D fence-diagram views.

Automate the first interpretation, refine boundaries directly and retain the project context needed to explain the subsurface model.

From Borehole Records to an Editable Interpretation

WinFence shares project data with WinLoG and GaeaSynergy. Select a section alignment, display the relevant boreholes and let WinFence create an initial correlation from available lithology, thickness and occurrence information. The interpretation remains editable throughout the process.

  • Create section alignments on the project map or define them manually
  • Use project boreholes, wells and intersecting cross-sections
  • Generate an initial set of correlated strata automatically
  • Add, reshape, split and refine interpreted units
  • Review the result against the underlying investigation data
Professional interpretation: Automatically generated strata are a starting point, not a verified geological model. A qualified user should review every correlation against data quality, borehole spacing and site geology.

Core WinFence Features

Tools for building, refining, presenting and reusing geological interpretations.

Automatic Strata Generation

Develop an initial interpretation from lithology similarities, unit thicknesses, occurrences and relationships at intersecting sections.

Manual Interpretation

Create a section manually or edit the generated result so the final boundaries reflect the user’s geological interpretation.

Boundary Snapping

Fix one strata boundary to another to enter connected contacts quickly and keep shared boundaries aligned.

Map-Based Alignment

Lay out the cross-section within the mapped project context and use borehole locations along the selected alignment.

Scale and Exaggeration

Control horizontal and vertical presentation so shallow, deep, long or compact investigations remain readable.

Full-Colour Presentation

Use distinct strata styles and project-view layouts to communicate interpreted units and supporting records clearly.

Deviated Boreholes

Represent deviated boreholes for projects where the investigation trace is not simply vertical.

3D Fence Diagrams

Combine completed cross-sections in a spatial 3D view and inspect their intersections from different directions.

Project Views and Output

Place cross-sections in project views for consistent presentation, printing and PDF delivery.

Represent More Than Simple Horizontal Layers

WinFence supports different interpreted strata forms so cross-sections can express discontinuities, localized units and project-specific zones rather than forcing every condition into a continuous layer.

LayersContinuous or laterally varying stratigraphic units.
LensesLocalized bodies that thin and terminate within the section.
FaultsStructural breaks affecting unit continuity and geometry.
IntrusionsInterpreted intrusive bodies cutting surrounding units.
Alteration zonesZones such as mineralization or other altered material.
Pinch-outsUnits that taper or disappear between investigation points.

Keep Interpretation Traceable

Use borehole descriptions, symbols, samples, graphs, water levels and other relevant tracks to support each correlation. Where confidence changes between investigation points, the presentation and project notes should make that uncertainty clear.

  • Retain the source borehole records
  • Use consistent lithology and strata names
  • Document unusual correlations and missing units
  • Review intersections between cross-sections
  • Avoid over-interpreting sparse data

Display WinLoG Data with the Cross-Section

Use up to three selected data types at each borehole location to support correlation without reproducing the entire log.

Lithology and Strata

Show interval symbols, descriptions and strata names used to compare units between boreholes.

Samples and Core

Plot sample or core information at its recorded depth to support geotechnical and geological interpretation.

Geophysical Logs

Display selected curves beside the borehole where continuous measurements help correlate subsurface units.

Groundwater Levels

Include recorded water levels to compare groundwater observations with interpreted geology.

Well Construction

Show casing, screen, seals and related completion information where the well design is relevant.

Test and Laboratory Data

Add selected values, graphs or text from geotechnical and laboratory records to assist interpretation.

A Practical Cross-Section Workflow

Move from a defined interpretation question to a reviewable 2D section and 3D presentation.

1

Prepare the Borehole Data

Check coordinates, elevations, depths, units, lithology names and the records needed for correlation.

2

Define the Alignment

Create the section on the project map or manually select the alignment and investigation points.

3

Select Supporting Tracks

Choose the most useful WinLoG data types for understanding and explaining the interpretation.

4

Generate or Draw Strata

Use automatic generation as a starting point or construct the strata manually where appropriate.

5

Edit and Review

Snap and refine boundaries, check intersections and compare every interpreted unit with the source data.

6

Present and Deliver

Place the section in a project view, create 3D fence views when useful and prepare the required output.

Applications Across Subsurface Projects

Adapt the section content and presentation to the technical question being addressed.

Geotechnical

Compare soil and rock units, weak zones, groundwater and investigation results along design alignments.

Environmental

Relate monitoring wells, stratigraphy, samples and interpreted migration pathways across a site.

Hydrogeology

Present aquifers, aquitards, well completions and groundwater observations in geological context.

Mining and Exploration

Display geological units, faults, intrusions, alteration and deviated boreholes across an exploration area.

WinFence Resources

Use the feature overview for planning and the current guides for step-by-step procedures and interpretation practices.

WinFence Feature Guide

Review automatic strata generation, snapping, integrated data and 3D fence diagrams.

Read the feature guide

WinLoG Integration

See which borehole and well records can be used to support cross-section interpretation.

Review supported data

Fence Diagram Workflow

Follow the preparation, creation, scaling, review and 3D presentation workflow.

Open the workflow guide

Cross-Section Demo

See WinFence cross-section creation and visualization in a focused product demonstration.

View the demonstration guide

Examples

Review finished cross-sections and fence diagrams for different subsurface applications.

Explore WinFence examples

WinLoG

Learn how the shared borehole database supplies the records displayed in WinFence.

Explore WinLoG

Turn Borehole Data into a Clear Subsurface Interpretation

Create, refine and present geological cross-sections without rebuilding project data in a separate drafting system.