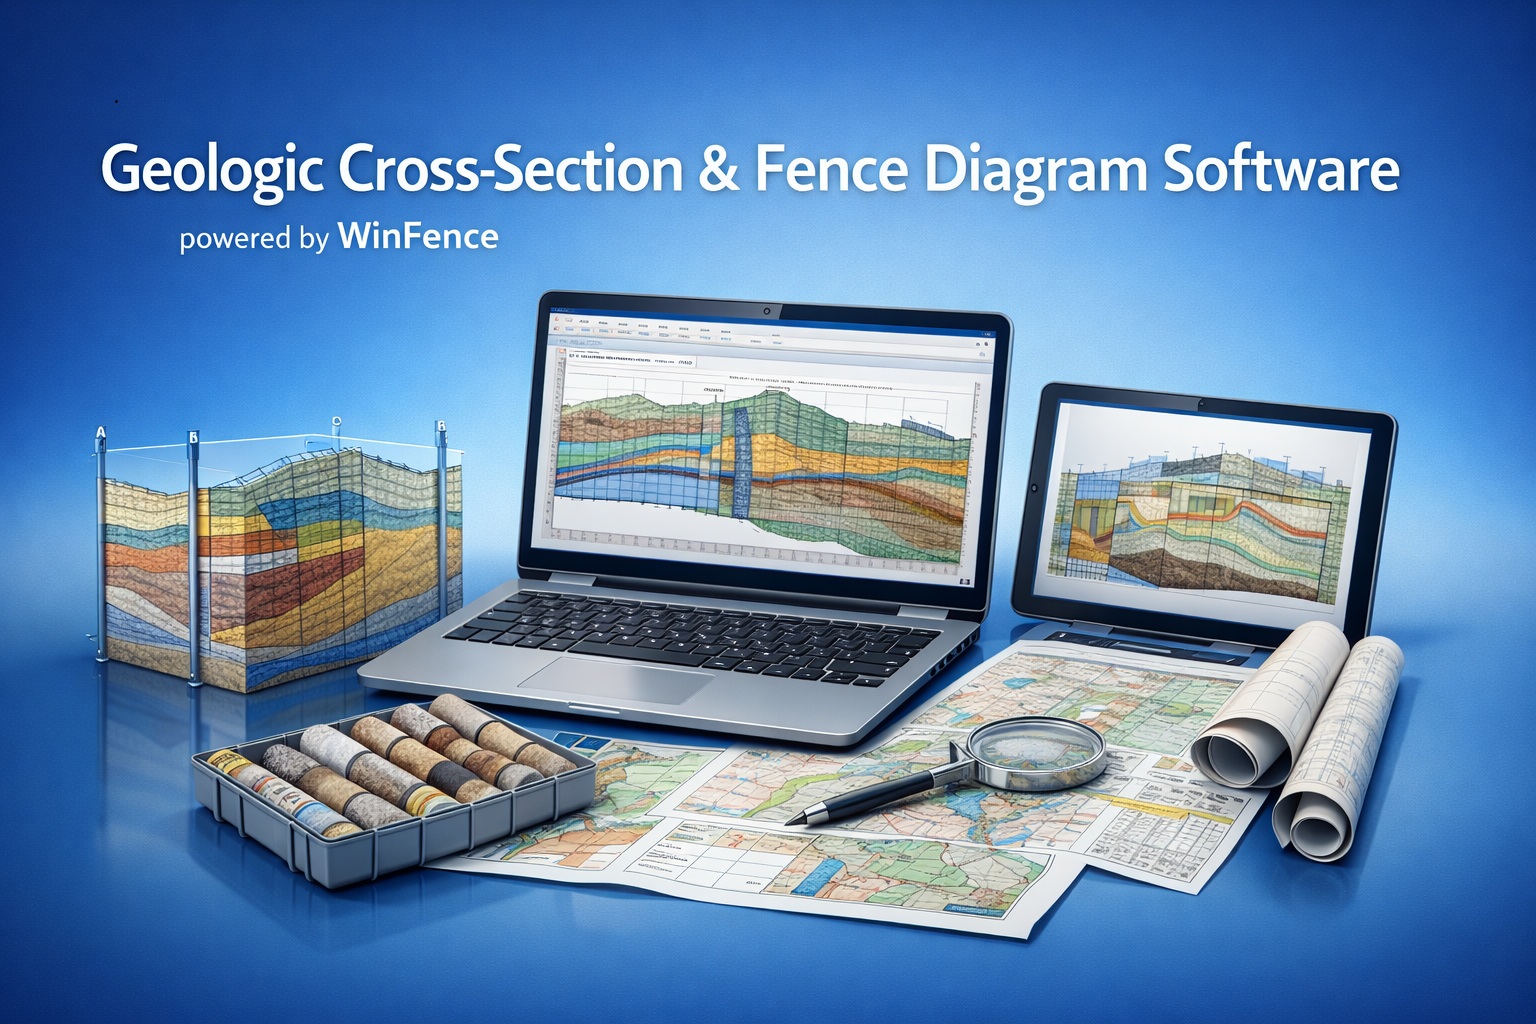
WinFence Subsurface Visualization

Geological Cross-Sections and 3D Fence Diagrams from Borehole Data

Create an editable initial strata interpretation, refine geological boundaries and present completed cross-sections in two or three dimensions.

Use the same connected project data as WinLoG—without redrawing borehole records in a separate CAD workflow.

Move Beyond Manual Cross-Section Drafting

General drafting tools can reproduce a drawing, but they do not automatically connect that drawing to the underlying borehole database.

Repeated Drafting

Changes to investigation data can require time-consuming updates to disconnected drawings.

Inconsistent Correlation

Strata names and boundaries can diverge when each section is maintained independently.

Disconnected Evidence

Samples, curves, water levels and well details may be separated from the interpretation they support.

Limited Spatial Context

A single 2D profile cannot show how several interpreted sections intersect across the site.

WinFence Capabilities

Create the initial interpretation efficiently while retaining control over the geological result and final presentation.

Initial Strata Generation

Generate an editable starting interpretation using similarities in lithology, thickness and occurrence.

Map-Based Alignments

Select boreholes and section paths in the project GIS or define a cross-section manually.

Intersecting-Section Logic

Use relationships where cross-sections intersect to support consistency across the project.

Boundary Snapping

Fix one strata boundary to another so connected contacts remain aligned during editing.

Flexible Strata Types

Represent layers, faults, lenses, intrusions and alteration or contamination zones.

Deviated Boreholes

Display non-vertical investigation traces for mining, exploration and petroleum projects.

3D Fence Diagrams

Combine completed sections in 3D views with pan, zoom, rotation, cameras and lighting.

Project Views and PDF

Place cross-sections in project-view layouts for printing and PDF delivery.

Professional-review requirement: Automatically generated strata are an editable starting interpretation, not a verified geological model. A qualified professional should review correlations against borehole spacing, data quality, site geology and uncertainty before the section is relied upon.

Display the Evidence Behind the Interpretation

WinFence and WinLoG use the same GaeaSynergy project database. Select up to three WinLoG data types at each borehole location to support correlation without reproducing the complete log.

  • Lithology symbols, descriptions and strata names
  • Samples, core intervals and recovery
  • Geophysical curves or log images
  • Water-level observations
  • Scaled well construction
  • Selected geotechnical and laboratory results

Review WinLoG Data Types

WinFence Example Library

See Cross-Sections and Fence Diagrams in Practice

Browse ten examples covering geological, environmental, groundwater, geophysical, mining and oil-and-gas applications.

Each example includes a full-size preview, application classification, capability summary and related resources.

Browse All 10 Examples

Explore WinFence in Detail

Use focused product pages to evaluate capabilities, data requirements, examples and common questions.

Features

Review automatic and manual interpretation, snapping, strata types, GIS alignment, 3D views and output.

View Features

Data Types

See which WinLoG records can be displayed and how to select the best three tracks for a section.

Review Data Types

Example Library

Filter ten cross-section and fence-diagram examples by output type and project application.

Browse Examples

FAQ

Find answers about data integration, interpretation, 3D display, PDF output, licensing and support.

Read the FAQ

A Practical WinFence Workflow

Move from prepared borehole data to a reviewed interpretation and final presentation.

1

Prepare Project Data

Check coordinates, elevations, depths, units, lithology and supporting records in WinLoG.

2

Define the Section

Select a map alignment or create the path manually, then choose the supporting data tracks.

3

Generate and Refine

Create an initial correlation or draw strata manually, then edit, snap and review boundaries.

4

Present and Deliver

Create project views, inspect connected sections in 3D and prepare the required PDF output.

Compare Cross-Section Software

Review how WinFence, QuickFence and RockWorks differ in workflow, integration, geological interpretation, output and licensing approach.

Read the Current Comparison

Create Clear, Reviewable Subsurface Interpretations

Evaluate WinFence with your borehole data, explore the examples or select the license that fits your team.